Departmental Results Report 2016-17
Table of contents
- Ministers' message
- Results at a glance
- Raison d'être, mandate and role: who we are and what we do
- Operating context and key risks
- Results: what we achieved
- Analysis of trends in spending and human resources
- Supplementary information
- Appendix: definitions
- Endnotes
Ministers' message

The Honourable Kirsty Duncan
Minister of Science
I am pleased to report progress made on making Canada a world-leading centre for innovation, helping create good, well-paying jobs, and strengthening and growing the middle class.
The work of the Innovation, Science and Economic Development Portfolio includes promoting innovation; supporting the commercialization of more research and ideas; providing more Canadians with the skills to participate in a global and digital economy; helping small businesses grow through innovation, access to capital and trade; promoting increased tourism in Canada; and supporting scientific research and the integration of scientific considerations in our investment and policy choices.
This year, the Portfolio organizations continued their work to deliver on the Government’s Budget 2017 commitment to develop an Innovation and Skills Plan. The plan’s focus on people and addressing the changing nature of the economy is a focus for the Portfolio’s programs.
It is my pleasure to present the 2016–17 Departmental Results Report for the Natural Sciences and Engineering Research Council of Canada.
Plans at a glance
For more information on the department’s plans, priorities and results achieved, see the “Results: what we achieved” section of this report.
| What funds were used? (2016–17 Actual Spending) |
Who was involved? (2016–17 Actual Full-Time Equivalents [FTEs]) |
|---|---|
| $1,191,260,893 | 412 |
- In 2016-17, NSERC supported more than 33,000 university students and postdoctoral fellows in the natural sciences and engineering (NSE) in Canada. NSERC funds nearly 40 percent of the postgraduate students in the NSE and a majority of these individuals go on to work in an R&D capacity and science and technology related occupation in Canada. This support has helped Canada maintain its international rankings in the number of researchers and doctoral graduate rates.
- NSERC funds the creation of new knowledge and maintenance of a high quality Canadian broad based research capacity in the NSE. In 2016-17, more than 11,000 university professors benefitted from NSERC’s support through grants. NSERC-supported scientists and engineers ensure that Canada’s scientific output in the NSE is among the most productive and highest quality in the world. These researchers also collaborate extensively with international researchers and secure Canada’s access to global scientific and engineering knowledge and expertise.
- NSERC fosters innovation by encouraging Canadian companies to participate and invest in post-secondary research projects. In 2016-17, NSERC partnered with more than 3,600 Canadian companies who contributed more than $220 million on joint research projects with universities and colleges that resulted in new products and services. In addition, more than 11,000 university students and postdoctoral fellows gained industrial experience from these collaborative projects.
Raison d’être, mandate and role: who we are and what we do
Raison d’être
The Natural Sciences and Engineering Research Council of Canada (NSERC) is a key player in building a culture of scientific discovery and innovation in Canada and in making this country a leader in discovery and innovation. To advance the prosperity and quality of life of all Canadians, NSERC acts as a convener of discovery and innovation partners with a goal of maximizing the value of public investments in science and engineering research.
In today’s highly competitive global economy, NSERC plays a central role in supporting Canada’s innovation ecosystem. NSERC supports research that benefits all Canadians. By connecting this innovative research to industry through its partnership initiatives, NSERC also makes it easier for the private sector to collaborate with academia and access the wealth of resources Canada’s first-rate academic system has to offer.
Canada’s future discoverers and innovators can realize their full potential with the support of NSERC’s scholarships and fellowships programs, along with funding provided through discovery and partnership awards.
NSERC is also actively working to enhance the profile of Canadian research through national and international promotional activities and by connecting with industry.
Mandate and role
NSERC’s vision is to help make Canada a country of discoverers and innovators for the benefit of all Canadians. It invests in People, Discovery and Innovation through partnerships and programs that support post-secondary research in the natural sciences and engineering.
NSERC is a departmental corporation of the Government of Canada created in 1978. It is funded directly by Parliament and reports to it through the Minister of Science. NSERC’s Council is composed of a President and up to 18 other distinguished members selected from the private and public sectors. NSERC’s President is the Chief Executive Officer. The elected Vice-President is the Chair of the Council and of its Executive Committee. NSERC’s Council is advised on policy matters by various standing committees. Funding decisions are made by the President, or designate, on the basis of recommendations made by peer review committees.
The functions of NSERC, based on the authority and responsibility assigned to it under the Natural Sciences and Engineering Research Council Act (1976-1977, c.24), are to:
- promote and assist research in the natural sciences and engineering, other than the health sciences; and
- advise the Minister in respect of such matters relating to such research as the Minister may refer to the Council for its consideration.
NSERC supports more than 11,000 of the most creative and productive Canadian university professors, over 33,000 highly qualified students and postdoctoral fellows, and partners with more than 3,600 Canadian firms to transfer knowledge that creates economic wealth.
For more general information about the department, see the “Supplementary information” section of this report. For more information on the department’s organizational mandate letter commitments, see the Minister’s mandate letter.i
Operating context and key risks
Operating context
As noted by the Advisory Council on Economic Growth, “innovation is crucial to addressing the core challenge of maintaining living standards and growing our economic output”. ii
The Government of Canada and NSERC recognize that Canada’s long-term economic prosperity will be determined by the ability of Canadians to harness the results of investments in natural sciences and engineering research and development. New innovations in emerging and disruptive technologies in areas such as clean technologies, big data analytics and artificial intelligence are driving the need for new skills, ideas and innovations.
In December 2015, following a year of extensive consultations with post-secondary, government and business stakeholders, NSERC released its strategic plan, NSERC 2020, that articulated five goals that the agency will pursue to position Canada for the future. Working groups of NSERC directors and managers were created to identify specific actions that would advance the NSERC 2020 goals within existing resources. Several of those initiatives and their results are reflected in this report.
NSERC, as a small agency, may be limited in its ability to reallocate/utilize resources effectively to meet operational needs and respond to government priorities. Governance and decision-making underpin NSERC’s ability to manage change. NSERC is presently responding to the Audit of Integrated Planning and Risk Management (2017) iii, which will improve NSERC’s ability to align priorities with resources and mitigate risk.
Key risks
NSERC’s strategic and operational priorities are managed and monitored according to NSERC’s Corporate Risk Profile. Based on an annual review of corporate risk, three areas emerged as priorities for risk mitigation in 2016-17.
| Risks | Mitigating strategy and effectiveness | Link to the department’s Programs | Link to mandate letter commitments or to government wide and departmental priorities |
|---|---|---|---|
Business Transformation (Existing) |
In response to this risk, NSERC put in place a number of initiatives:
|
Program 1.1: People: Research Talent Program 1.2: Discovery: Advancement of Knowledge Program 1.3: Innovation: Research Partnerships |
Minister of Science Mandate Letter Innovation Agendaiv Results and Deliveryv |
Demonstrating Results and Relevance |
In response to this risk, NSERC implemented key requirements of the Policy on Results by:
The organization will continue to focus on clarifying data governance and management of the coming year to ensure greater accuracy, and alignment with the other granting agencies. |
||
Stakeholder Relations |
In response to this risk, NSERC put in place the following measures:
|
Results: what we achieved
Programs
Program 1.1 – People: Research Talent
Description
This program supports the attraction, retention and development of highly qualified people in the natural sciences and engineering in Canada through Research Chairs Programs, fellowships, scholarships and grants to science promotion organizations. These activities are essential to building the human capital required to enable a strong, globally competitive research and innovation system in Canada. Researchers, students and young people benefit from the grant funding which supports post-secondary university research as well as some outreach activities at universities, museums, science centres, and community-based organizations.
Results
Canada is performing relatively well on the three indicators chosen to highlight NSERC’s People: Research Talent investments. At 8.8 researchers per thousand employed, Canada ranks 7th relative to other G20 countries (based on latest data of 2014). In 2016, the overall unemployment rate of 3.4 percent for occupations in the natural sciences and engineering was less than half the overall general unemployment rate of 7 percent.
Compared to the previous year, in 2014, total doctoral degrees granted in the NSE in Canada rose by 2.2 percent to reach nearly 3,600 graduates of which 31.9 percent were females. During the same year, the total, full-time bachelor enrolment in the NSE increased by 5.4 percent compared to 2013-14. In 2014-15, male NSE enrolment increased by 5 percent to reach nearly 121,000 students, while female NSE enrolment increased by 6 percent, representing nearly 75,000 female students. Increasing participation of youth in university education, favourable demographics, and NSERC’s ongoing leadership role in science and engineering promotion in Canada have all helped to push NSE bachelor’s enrolment ever higher.
Highlights
- Eighty-one Promosciencevi awards were granted in 2016; 21 grants to support organizations providing outreach programming for girls; 32 grants were awarded to organizations focused on Indigenous youth.
- Science Odyssey 2016vii celebration brought together 200 partners from across the country to host nearly 600 events.
- In September 2016, NSERC supported Science Literacy weekviii.
- NSERC partnered with the Museum of Science and Technology and other partners to support the new STEAM Horizon Awardsix.
- NSERC broadened its AANSEx Program to support additional Indigenous Ambassadors beyond those who hold an NSERC scholarship/fellowship.
Through its Scholarships and Fellowships Programs, NSERC supports a significant number of outstanding students at various stages of their university studies. In doing so, it ensures that Canada has a reliable supply of highly skilled and qualified personnel and attracts talented future researchers. As part of its on-going initiatives to position these programs for students to acquire market-ready skills in addition to research training, NSERC and the German Research Foundation, Deutsche Forschungsgemeinschaftxi (DFG) finalized changes to improve a joint NSERC-DFG student training program through NSERC’s Collaborative Research and Training Experience Programxii (CREATE) and DFG’s International Research Training Group. Moreover, in 2016-17, more than 11,000 students and fellows received support from NSERC to enable them to gain industry-relevant R&D experience.
Overall, in 2016-17, NSERC supported a total of 33,400 students and postdoctoral fellows through scholarships, fellowships as well as research grants. Figure 1.0 shows the support provided in 2016-17 through scholarships and fellowships for some selected NSERC programs.
Figure 1 No. of Scholarships and Fellowships Supported for Selected NSERC Programs in 2016-17

CGS: Canada Graduate Scholarship, M; Master’s, D: Doctorate, PGS: Postgraduate Scholarships, IPS: Industrial Postgraduate Scholarships, Vanier: Vanier Scholarships, PDF: Postdoctoral Fellowships, IRDF: Industrial R&D Fellowships.
| Expected Results | Performance Indicators | Target | Date to achieve target | 2016-17 Actual results | 2015-16 Actual results | 2014-15 Actual results |
|---|---|---|---|---|---|---|
| Canada's workforce has the required talented and skilled researchers in natural sciences and engineering. | Total researchers per thousand employed. | 8.3 | Ongoing | 8.8 | 8.8 | 8.9 |
| Percentage difference in unemployment rate for occupations in the natural sciences and engineering vs. national unemployment rate. | 1% | Overall: 3.6% Males: 4.4% Females: 2.5% |
3.7% | 3.9% | ||
| Ranking of Canada among G20 countries in terms of number of doctoral degrees earned in the natural sciences and engineering per capita. | 15th | 7th | 7th | 6th |
| 2016-17 Main estimates |
2016-17 Planned spending |
2016-17 Total authorities available for use |
2016-17 Actual spending (authorities used) |
2016-17 Difference (actual minus planned) |
|---|---|---|---|---|
| $287,561,563 | $287,561,563 | $290,257,615 | $274,215,021 | $-13,346,542 |
| 2016-17 Planned |
2016-17 Actual |
2016-17 Difference (actual minus planned) |
|---|---|---|
| 36 | 44 | 8 |
An explanation of the variance is provided under the "Budgetary performance summary for Programs and Internal Services" sub-section.
Program 1.2 – Discovery: Advancement of Knowledge
Description
This program supports the creation of new knowledge and maintenance of a high quality Canadian broad based research capacity in the natural sciences and engineering through grants to researchers. The advancement of knowledge generated by these grants is necessary to fuel a strong research and innovation system in Canada that is globally competitive. Academic researchers receive funding to carry out research, to support the timely acceleration of research programs, to purchase or develop research equipment, or to facilitate their effective access to major and unique research resources.
Results
Research results are mainly published in peer-reviewed journals, books and conference proceedings. These publications provide a measure of discovery and knowledge generation by researchers at the leading edge of their fields. Publication output is a good indicator of the immediate outcome of NSERC research funding, and can be used to benchmark Canada’s performance against the rest of the world.
Canadian research publication productivity is very high; the country ranked 2nd in the G20 on the per capita output of peer-reviewed journal publications in the NSE in 2015. Canada occupied the 11th position in terms of overall number of publications produced in 2015 by the G20.
The high quality and impact of Canadian research is evident in its ranking among top countries on the average number of times Canadian peer-reviewed publications are cited by other researchers. Citations are a measure of the knowledge flow and influence of a researcher’s work. Based on the number of citations received by scientific papers over the three years following the publication year, a standardized measure known as the Average Relative Citation factor is calculated for each country for international comparison purposes. Based on the most current data available (2015), Canada sits in 7th position in the G20.
Canada produces four percent of the world’s science and engineering publications. As such, it is important for Canadian researchers to access the latest knowledge and expertise from across Canada and the world. Collaborative research facilitates knowledge transfer and sharing among individuals, institutions, and nations. One indicator of this activity is the number of Canadian publications co-authored with foreign researchers. About 56 percent of Canadian publications in the NSE in 2015 had a foreign collaborator, and this percentage has been growing every year over the past decade.
Funding through the Discovery Grants (DG) Program allows Canada to build a solid capacity for basic research across a broad spectrum of natural sciences and engineering disciplines.
The 2016 competition awarded Discovery Grants to 369 early-career researchers and 1,725 established researchers. The success rate (number of awards divided by the number of applicants) for the 2016 competition was 66.1 percent. NSERC continues to promote and maintain a diversified base of high quality research capacity as well as support the development of early-career researchers.
Highlights
- As of 2016, NSERC introduced an optional one-year extension of the Discovery Grant (DG) of early-career researchers who are due to apply for their first renewal.
- NSERC continues to support the Discovery Development Grants (DDG), a pilot program started in 2015-16 to boost research capacity at small universities.
- NSERC piloted a new option within its Maternity/Parental Leave Policyxiii for grantees holding a DG or a DDG. Under this pilot policy, grantees who become primary caregivers during the tenure of their grant, and who are eligible to take extended maternity, parental or adoption leave, but decline taking this leave, are eligible for a one-year DG or DDG extension with funds.
- NSERC partnered with the Department of National Defence to provide a supplement to Discovery Grantees whose research falls within targeted defence and security priority areas.
- NSERC finalized its agreement to host the Gender Summit 11 North Americaxiv in 2017. The goal of the Summit is to explore equity and diversity in science, technology, engineering, and mathematics (STEM) research in the broadest sense (going beyond sex-based differences and including discussions on LGBTQ2 and Indigenous communities).
- NSERC implemented its Framework on Diversity and Gender Equity.
- As of 2016, NSERC integrated both discovery and innovation information in its outreach and engagement activities.
| Expected Results | Performance Indicators | Target | Date to achieve target | 2016-17 Actual results | 2015-16 Actual results | 2014-15 Actual results |
|---|---|---|---|---|---|---|
| Researchers at Canadian universities advance knowledge in the natural sciences and engineering. | Ranking in the per capita output of peer-reviewed journal publications in the natural sciences and engineering among the G20 countries. | 8th | Ongoing | 2nd | 2nd | 2nd |
| Ranking in the number of natural sciences and engineering publications among the G20 countries. | 9th | Ongoing | 11th | 11th | 11th | |
| Ranking in terms of average relative citation factor of Canadian publications in the natural sciences and engineering among the G20 countries. | 15th | Ongoing | 7th | 6th | 7th |
| 2016-17 Main estimates |
2016-17 Planned spending |
2016-17 Total authorities available for use |
2016-17 Actual spending (authorities used) |
2016-17 Difference (actual minus planned) |
|---|---|---|---|---|
| $435,524,043 | $435,524,043 | $497,143,763 | $504,451,902 | $68,927,859 |
| 2016-17 Planned |
2016-17 Actual |
2016-17 Difference (actual minus planned) |
|---|---|---|
| 62 | 85 | 23 |
An explanation of the variance is provided under the “Budgetary performance summary for Programs and Internal Services” sub-section.
Program 1.3 – Innovation: Research Partnerships
Description
This program fosters partnerships in natural sciences and engineering that facilitates the transfer of knowledge and skills to the user sector through awards that support research projects and network activities intended for socioeconomic impact. The partnerships encouraged and enabled by these awards also increase the commercialization of Canada’s research through new products, services, and processes for the benefit of all Canadians.
Results
In 2016-17, there was a 3.4 percent growth in the number of companies partnering with NSERC, compared to the previous year. Since the launch of the Strategy for Partnership and Innovation in 2009-10, the number of industrial partners participating in NSERC programs has grown steadily every year, reaching slightly more than 3,600 in 2016-17. The majority of the top 100 R&D firms in Canada are currently partners with NSERC’s funded researchers. Industrial partners contribute financially to post-secondary research projects, scholarships and fellowships.
The Association of University Technology Managers conducts a survey of intellectual property commercialization in the North American university sector every year. The following table shows that Canadian growth exceeded the 0.5 percent threshold for three of eight indicators in 2015 compared to 2014.
| Commercialization Activity | 2007 | 2008 | 2009 | 2010 | 2011 | 2012 | 2013 | 2014 | 2015 |
|---|---|---|---|---|---|---|---|---|---|
| Invention disclosures | 1,666 | 1,620 | 1,739 | 1,484 | 1,591 | 1,562 | 1,659 | 1,572 | 1,465 |
| Patent applications filed | 853 | 850 | 851 | 840 | 822 | 900 | 893 | 898 | 962 |
| U.S. patents issued | 156 | 103 | 108 | 124 | 157 | 157 | 196 | 236 | 234 |
| Licenses executed | 624 | 557 | 629 | 447 | 499 | 465 | 352 | 448 | N/A |
| Cumulative active licenses | 2,855 | 2,785 | 2,868 | 2,972 | 3,123 | 3,202 | 3,121 | 2,899 | 2,760 |
| Royalties from licensing ($M) | 58 | 52.4 | 54.7 | 51.9 | 58.7 | 64.1 | 49.8 | 84.4 | 51.3 |
| Spin-off companies initiated | 46 | 38 | 44 | 46 | 66 | 51 | 60 | 75 | 77 |
| Spin-off companies still in business | 604 | 595 | 575 | 608 | 657 | 585 | 579 | 450 | 460 |
| Business contract R&D revenue ($M)2 | 626 | 643 | 738 | 657 | 743 | 728 | 694 | 769 | 772 |
Sources: Association of University Technology Managers (AUTM), Canadian Association of University Business Officers (CAUBO).
1. Sample of Canadian universities including: Alberta, British Columbia, Guelph, Laval, Manitoba, Montreal, New Brunswick, Newfoundland, Ottawa, Saskatchewan, Sherbrooke, Toronto, Victoria, Waterloo, Dalhousie, École de Technologie Supérieure, Lakehead, McGill, McMaster, Mount Allison, Queen's, Ryerson, Saint Mary's, Simon Fraser, St Francis Xavier, University of Calgary, Western, Wilfrid Laurier and York.
2. all Canadian universities.
Canadian universities excel at attracting funding from companies to conduct collaborative research of importance to the firm. While overall business R&D spending by Canadian firms has stagnated for the past decade, Canadian firms have increased their funding for university R&D. Industry funding for NSERC sponsored research partnerships continues to climb, and has more than doubled over the past decade, starting at nearly $80 million in 2006-07 to over $220 million in 2016-17. The latest year-over-year increase in industry funding was 8 percent.
In 2016-17, NSERC’s Research Partnerships Program continued to provide tangible impacts for researchers, company partners as well as trainees. Eighty-one percent of partner companies reported enhancement of knowledge and skills of personnel, 50 percent reported development of an improved product, process or service and one-in-three reported that the project provided them a competitive edge. In 2016-17, activities under this main program supported over 11,000 students and fellows in gaining industrial R&D experience. Since 2014, researchers reported that over 270 patents were filed or granted from projects supported under this program.
Over the last five competition years (2011-15), nearly 11,000 male applicants from academia submitted a Research Partnerships application as the principal investigator compared to nearly 2,000 female applicants; success rates were 69 percent and 67 percent respectively.
Highlights
- In 2016-17, more than 3,600 companies invested over $220 million in NSERC supported partnerships.
- Four major funding opportunities under this main program were on-boarded on an online reporting system. This initiative will provide NSERC with timely information about program performance.
- Through its regional offices, NSERC engaged in formal funding agreements at the regional, provincial and territorial levels.
- In 2016, NSERC partnered with Ontario Centres of Excellence (OCE) in the TargetGHC Collaborative R&D Program. This joint initiative enables technology development between post-secondary institutions and industry partners for the reduction of greenhouse gas emissions.
- In 2016, NSERC announced five new Technology Access Centres (TACs)xv in addition to the 25 TACs already funded by the Tri-Agency College and Community Innovative Program.
| Expected Results | Performance Indicators | Target | Date to achieve target | 2016-17 Actual results | 2015-16 Actual results | 2014-15 Actual results |
|---|---|---|---|---|---|---|
| Canada builds more research partnerships between businesses, universities and colleges. | Percentage growth in the number of business partners annually. | 5% | Ongoing | 3.4% | 0.0% | 13.2% |
| Minimum percentage growth in most of the indicators of knowledge/technology transfer (new and/or improved products/services, enhanced skills/knowledge of partner personnel, invention disclosures, university spin-offs, university licensing revenue, university R&D contract revenue, university patents). | 0.5% growth for a majority of nine indicators | Ongoing | Growth exceeds 0.5% for 3 out of 8 indicators | Growth exceeds 0.5% for 5 out of 9 indicators | Growth exceeds 0.5% for 4 out of 9 indicators |
| 2016-17 Main estimates |
2016-17 Planned spending |
2016-17 Total authorities available for use |
2016-17 Actual spending (authorities used) |
2016-17 Difference (actual minus planned) |
|---|---|---|---|---|
| $375,358,464 | $375,358,464 | $383,743,998 | $393,056,929 | $17,698,465 |
| 2016-17 Planned |
2016-17 Actual |
2016-17 Difference (actual minus planned) |
|---|---|---|
| 132 | 146 | 14 |
An explanation of the variance is provided under the “Budgetary performance summary for Programs and Internal Services” sub-section.
Information on NSERC’s lower-level programs is available on the departmental websitexvi and in the TBS InfoBase. xvii
Internal Services
Description
Internal Services are those groups of related activities and resources that the federal government considers to be services in support of programs and/or required to meet corporate obligations of an organization. Internal Services refers to the activities and resources of the 10 distinct service categories that support Program delivery in the organization, regardless of the Internal Services delivery model in a department. The 10 service categories are: Management and Oversight Services; Communications Services; Legal Services; Human Resources Management Services; Financial Management Services; Information Management Services; Information Technology Services; Real Property Services; Materiel Services; and Acquisition Services.
Results
In 2016-17, NSERC continued to post annual award and funding results datasets (by award, co-applicant and partner) on the Government of Canada’s Open Dataxviii website. As per the directive on Open Governmentxix, a methodology for creating and maintaining comprehensive inventories of data and information resources to determine their eligibility and priority was established and approved by senior management. An approval process for the release of open data and open information resources was implemented. Moreover, NSERC is participating in a Tri-agency Open Data working group led by the Social Sciences and Humanities Research Council (SSHRC) in order to increase the comparability of the data collected and released by each funding agency, and to explore opportunities for a harmonized approach to our respective Open Government commitments.
In view of streamlining and harmonizing business processes and replacing aging technologies currently in use, NSERC, in partnership with SSHRC, prepared a business case and project charter for a bi-agency grants management system with the intent of seeking government project authority.
NSERC completed its transition from its Human Resources Information System (HRIS) to the PeopleSoft platform in 2016-17. Discussions continue to ensure NSERC’s needs as a separate agency are identified and considered within the enterprise-wide platform (PeopleSoft).
In 2016-17, NSERC and SSHRC redesigned their Joint Investment Management Committee to promote transparency of common administrative services, activities and expenditures and to support bi-agency discussion on and governance of common issues, risks and priorities.
| 2016-17 Main estimates |
2016-17 Planned spending |
2016-17 Total authorities available for use |
2016-17 Actual spending (authorities used) |
2016-17 Difference (actual minus planned) |
|---|---|---|---|---|
| $21,740,599 | $21,740,599 | $23,924,221 | $19,537,041 | $-2,203,558 |
| 2016-17 Planned |
2016-17 Actual |
2016-17 Difference (actual minus planned) |
|---|---|---|
| 164 | 137 | -27 |
An explanation of the variance is provided under the “Budgetary performance summary for Programs and Internal Services” sub-section.
Analysis of trends in spending and human resources
Actual expenditures
Departmental spending trend graph
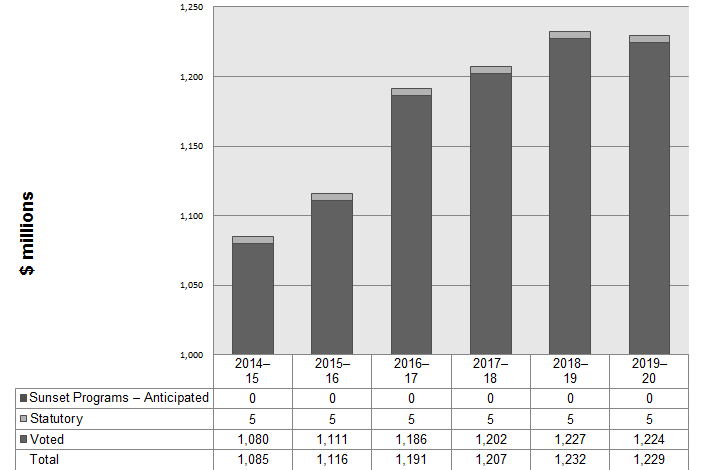
Expenditure Profile Explanation
Changes from 2014-15 to 2018-19 are mostly due to Budget 2014 announcement of the new Canada First Research Excellence Fund, a tri-agency initiative that helps institutions excel globally in research areas that create long-term economic advantages for Canada.
Additional funding in 2016-17 is also a result of Budget 2015 that included support for partnerships between businesses and academic researchers and for the College and Community Innovation (CCI) Program, and Budget 2016 which added resources to support discovery research in the natural sciences and engineering.
Budgetary performance summary for Programs and Internal Services (dollars)
| Programs and Internal Services | 2016–17 Main Estimates |
2016–17 Planned spending |
2017–18 Planned spending |
2018–19 Planned spending |
2016–17 Total authorities available for use |
2016–17 Actual spending (authorities used) |
2015–16 Actual spending (authorities used) |
2014–15 Actual spending (authorities used) |
|---|---|---|---|---|---|---|---|---|
| 1.1 People: Research Talent | 287,561,563 | 287,561,563 | 287,882,897 | 278,914,912 | 290,257,615 | 274,215,021 | 273,271,214 | 272,162,729 |
| 1.2 Discovery: Advancement of Knowledge | 435,524,043 | 435,524,043 | 522,502,495 | 559,025,804 | 497,143,763 | 504,451,902 | 454,997,430 | 417,812,704 |
| 1.3 Innovation: Research Partnerships | 375,358,464 | 375,358,464 | 378,552,344 | 375,760,981 | 383,743,998 | 393,056,929 | 369,402,138 | 371,301,195 |
| Subtotal | 1,098,444,070 | 1,098,444,070 | 1,188,937,736 | 1,213,701,697 | 1,171,145,376 | 1,171,723,852 | 1,097,670,782 | 1,061,276,628 |
| Internal Services | 21,740,599 | 21,740,599 | 18,092,409 | 18,036,718 | 23,924,221 | 19,537,041 | 17,982,412 | 24,168,828 |
| Total | 1,120,184,669 | 1,120,184,669 | 1,207,030,145 | 1,231,738,415 | 1,195,069,597 | 1,191,260,893 | 1,115,653,194 | 1,085,445,456 |
Actual human resources
Human resources summary for Programs and Internal Services (full time equivalents)
| Programs and Internal Services | 2014–15 Actual | 2015–16 Actual | 2016–17 Planned | 2016–17 Actual | 2017–18 Planned | 2018–19 Planned |
|---|---|---|---|---|---|---|
| 1.1 People: Research Talent | 35 | 43 | 36 | 44 | 45 | 45 |
| 1.2 Discovery: Advancement of Knowledge | 55 | 82 | 62 | 85 | 89 | 89 |
| 1.3 Innovation: Research Partnerships | 119 | 147 | 132 | 146 | 150 | 150 |
| Subtotal | 209 | 272 | 230 | 275 | 284 | 284 |
| Internal Services | 174 | 131 | 164 | 137 | 133 | 133 |
| Total | 383 | 403 | 394 | 412 | 417 | 417 |
The variance in FTEs is explained by the increase of programs, communication and support services in delivering of funds for and the implementation of Budget 2015(Research Partnerships programs and College and Community Innovation) and Budget 2016 (Discovery Research).
The variance in Internal Services' actuals from 2014-15 and subsequent years is due to a change in the reallocation of internal services to programs, based on TBS’ Guide on Recording and Reporting of Internal Services Expenditures effective April 1, 2015.
Expenditures by vote
For information on the [name of department]’s organizational voted and statutory expenditures, consult the Public Accounts of Canada 2017.xx
Alignment of spending with the whole-of-government framework
Alignment of 201617 actual spending with the whole-of-government frameworkxxi (dollars)
| Program | Spending area | Government of Canada activity | 2016–17 Actual spending |
|---|---|---|---|
| 1.1 People: Research Talent | Economic Affairs | An innovative and knowledge-based economy | 274,215,021 |
| 1.2 Discovery: Advancement of Knowledge | Economic Affairs | An innovative and knowledge-based economy | 504,451,902 |
| 1.3 Innovation: Research Partnership | Economic Affairs | An innovative and knowledge-based economy | 393,056,929 |
| Total | 1,171,723,852 |
| Spending area | Total planned spending | Total actual spending |
|---|---|---|
| Economic affairs | 1,098,444,070 | 1,171,723,852 |
| Social affairs | N/A | N/A |
| International affairs | N/A | N/A |
| Government affairs | N/A | N/A |
Financial statements and financial statements highlights
Financial statements
The Natural Sciences and Engineering Research Council of Canada’s financial statements for the year ended March 31, 2017, are available on the departmental website.
Financial statements highlights
Condensed Statement of Operations (unaudited) for the year ended March 31, 2017 (dollars)
| Financial information | 2016–17 Planned results | 2016–17 Actual | 2015–16 Actual | Difference (2016–17 actual minus 2016–17 planned) | Difference (2016–17 actual minus 2015–16 actual) |
|---|---|---|---|---|---|
| Total expenses | 1,127,797,947 | 1,196,000,945 | 1,120,209,758 | 68,202,998 | 75,791,187 |
| Total revenues | 379,000 | 172,472 | 84,661 | (206,528) | 87,811 |
| Net cost of operations before government funding and transfers | 1,127,418,947 | 1,195,828,473 | 1,120,125,097 | 68,409,526 | 75,703,376 |
The increase in total expenses over previous year is mainly due to higher grant and scholarship payments in the following initiatives:
- an increase of $35.3 million in the Canada First Research Excellence Fund due to the second round of competition in 2016-17;
- an increase of $12.8 million for research in strategic areas and in life sciences related research projects (Budget 2015);
- an increase of $10.3 million to support collaborations between companies and researchers from universities and colleges under the new consolidated suite of similar business innovation programs due to an increasing demand;
- an increase of $9.8 million to fund discovery research (Budget 2016); and
- an increase of $5.6 million for the College and Community Innovation Program, directed to industry-driven applied research initiatives at Canada’s polytechnics and colleges (Budget 2015).
Condensed Statement of Financial Position (unaudited) as at March 31, 2017 (dollars)
| Financial Information | 2016–17 | 2015–16 | Difference (2016–17 minus 2015–16) |
|---|---|---|---|
| Total net liabilities | 8,257,369 | 7,877,069 | 380,300 |
| Total net financial assets | 5,918,474 | 5,366,641 | 551,833 |
| Departmental net debt | 2,338,895 | 2,510,428 | (171,533) |
| Total non-financial assets | 5,217,925 | 6,724,006 | (1,506,081) |
| Departmental net financial position | 2,879,030 | 4,213,578 | (1,334,548) |
The decrease in non-financial assets is mainly due to the annual depreciation of the Council’s tangible capital assets, which surpassed the additions made during the year.
Supplementary information
Corporate information
Organizational profile
Appropriate minister[s]: Minister of Science: The Honourable Kirsty Duncan, P.C., M.P.
Institutional head: Dr. B. Mario Pinto (President)
Ministerial portfolio: Innovation, Science and Economic Development
Enabling instrument[s]: Natural Sciences and Engineering Research Council Actxxii
Year of incorporation / commencement: May 1, 1978
Reporting framework
The Natural Sciences and Engineering Research Council of Canada’s Strategic Outcome[s] and Program Alignment Architecture of record for 2016–17 are shown below.
1. Strategic Outcome:
Canada is a world leader in advancing, connecting and applying new knowledge in natural sciences and engineering.
- 1.1 - Program: People: Research, Talent
- 1.2 - Program: Discovery: Advancement of Knowledge
- 1.2.1: Discovery Research
- 1.2.2: Research Equipment and Resources
- 1.2.3: Canada First Research Excellence Fund*
- 1.3 - Program: Innovation: Research Partnerships
- 1.4 - Internal Services
*Programs involving more than one federal granting agency
Supporting information on lower-level programs
Supporting information on lower level programs is available on the Natural Sciences and Engineering Research Council of Canada’s website.
Supplementary information tables
The following supplementary information tables are available on the Natural Sciences and Engineering Research Council of Canada’s website :
- Departmental Sustainable Development Strategy
- Details on transfer payment programs of $5 million or more
- Internal audits and evaluations
Federal tax expenditures
The tax system can be used to achieve public policy objectives through the application of special measures such as low tax rates, exemptions, deductions, deferrals and credits. The Department of Finance Canada publishes cost estimates and projections for these measures each year in the Report on Federal Tax Expenditures. This report also provides detailed background information on tax expenditures, including descriptions, objectives, historical information and references to related federal spending programs. The tax measures presented in this report are the responsibility of the Minister of Finance.
Organizational contact information
Barney Laciak
Manager, Corporate Planning and Reporting
Natural Sciences and Engineering Research Council of Canada
Telephone: 613-996-1079
Email: barney.laciak@nserc-crsng.gc.ca
Appendix: definitions
appropriation (crédit): Any authority of Parliament to pay money out of the Consolidated Revenue Fund.
budgetary expenditures (dépenses budgétaires): Includes operating and capital expenditures; transfer payments to other levels of government, organizations or individuals; and payments to Crown corporations.
Core Responsibility (responsabilité essentielle) An enduring function or role performed by a department. The intentions of the department with respect to a Core Responsibility are reflected in one or more related Departmental Results that the department seeks to contribute to or influence.
Departmental Plan (Plan ministériel) Provides information on the plans and expected performance of appropriated departments over a three year period. Departmental Plans are tabled in Parliament each spring.
Departmental Result (résultat ministériel) A Departmental Result represents the change or changes that the department seeks to influence. A Departmental Result is often outside departments’ immediate control, but it should be influenced by program-level outcomes.
Departmental Result Indicator (indicateur de résultat ministériel) A factor or variable that provides a valid and reliable means to measure or describe progress on a Departmental Result.
Departmental Results Framework (cadre ministériel des résultats) Consists of the department’s Core Responsibilities, Departmental Results and Departmental Result Indicators.
Departmental Results Report (Rapport sur les résultats ministériels) Provides information on the actual accomplishments against the plans, priorities and expected results set out in the corresponding Departmental Plan.
Evaluation (évaluation) In the Government of Canada, the systematic and neutral collection and analysis of evidence to judge merit, worth or value. Evaluation informs decision making, improvements, innovation and accountability. Evaluations typically focus on programs, policies and priorities and examine questions related to relevance, effectiveness and efficiency. Depending on user needs, however, evaluations can also examine other units, themes and issues, including alternatives to existing interventions. Evaluations generally employ social science research methods.
full-time equivalent (équivalent temps plein): A measure of the extent to which an employee represents a full person year charge against a departmental budget. Full time equivalents are calculated as a ratio of assigned hours of work to scheduled hours of work. Scheduled hours of work are set out in collective agreements.
government-wide priorities (priorités pangouvernementales) For the purpose of the 2016–17 Departmental Results Report, government-wide priorities refers to those high-level themes outlining the government’s agenda in the 2015 Speech from the Throne, namely: Growth for the Middle Class; Open and Transparent Government; A Clean Environment and a Strong Economy; Diversity is Canada's Strength; and Security and Opportunity.
horizontal initiatives (initiative horizontale) An initiative where two or more federal organizations, through an approved funding agreement, work toward achieving clearly defined shared outcomes, and which has been designated (for example, by Cabinet or a central agency) as a horizontal initiative for managing and reporting purposes.
Management, Resources and Results Structure (Structure de la gestion, des ressources et des résultats) A comprehensive framework that consists of an organization’s inventory of programs, resources, results, performance indicators and governance information. Programs and results are depicted in their hierarchical relationship to each other and to the Strategic Outcome(s) to which they contribute. The Management, Resources and Results Structure is developed from the Program Alignment Architecture.
non budgetary expenditures (dépenses non budgétaires) Net outlays and receipts related to loans, investments and advances, which change the composition of the financial assets of the Government of Canada.
performance (rendement) What an organization did with its resources to achieve its results, how well those results compare to what the organization intended to achieve, and how well lessons learned have been identified.
performance indicator (indicateur de rendement) A qualitative or quantitative means of measuring an output or outcome, with the intention of gauging the performance of an organization, program, policy or initiative respecting expected results.
performance reporting (production de rapports sur le rendement) The process of communicating evidence based performance information. Performance reporting supports decision making, accountability and transparency.
planned spending (dépenses prévues) For Departmental Plans and Departmental Results Reports, planned spending refers to those amounts that receive Treasury Board approval by February 1. Therefore, planned spending may include amounts incremental to planned expenditures presented in the Main Estimates.
A department is expected to be aware of the authorities that it has sought and received. The determination of planned spending is a departmental responsibility, and departments must be able to defend the expenditure and accrual numbers presented in their Departmental Plans and Departmental Results Reports.
plans (plans) The articulation of strategic choices, which provides information on how an organization intends to achieve its priorities and associated results. Generally a plan will explain the logic behind the strategies chosen and tend to focus on actions that lead up to the expected result.
priorities (priorités) Plans or projects that an organization has chosen to focus and report on during the planning period. Priorities represent the things that are most important or what must be done first to support the achievement of the desired Strategic Outcome(s).
program (programme) A group of related resource inputs and activities that are managed to meet specific needs and to achieve intended results and that are treated as a budgetary unit.
Program Alignment Architecture (architecture d’alignement des programmes) A structured inventory of an organization’s programs depicting the hierarchical relationship between programs and the Strategic Outcome(s) to which they contribute.
results (résultat) An external consequence attributed, in part, to an organization, policy, program or initiative. Results are not within the control of a single organization, policy, program or initiative; instead they are within the area of the organization’s influence.
statutory expenditures (dépenses législatives) Expenditures that Parliament has approved through legislation other than appropriation acts. The legislation sets out the purpose of the expenditures and the terms and conditions under which they may be made.
Strategic Outcome (résultat stratégique) A long term and enduring benefit to Canadians that is linked to the organization’s mandate, vision and core functions.
sunset program (programme temporisé) A time limited program that does not have an ongoing funding and policy authority. When the program is set to expire, a decision must be made whether to continue the program. In the case of a renewal, the decision specifies the scope, funding level and duration.
target (cible) A measurable performance or success level that an organization, program or initiative plans to achieve within a specified time period. Targets can be either quantitative or qualitative.
voted expenditures (dépenses votées) Expenditures that Parliament approves annually through an Appropriation Act. The Vote wording becomes the governing conditions under which these expenditures may be made.
Endnotes
i: The Minister’s mandate letter, ![]() http://pm.gc.ca/eng/mandate-letters
http://pm.gc.ca/eng/mandate-letters
ii: ![]() Advisory Council on Economic Growth, Unlocking Innovation to Drive Economic Growth, 6 February 2017 (p. 2).
Advisory Council on Economic Growth, Unlocking Innovation to Drive Economic Growth, 6 February 2017 (p. 2).
iii: Natural Sciences and Engineering Research Council of Canada, Audit of Integrated Planning and Risk Management, http://www.nserc-crsng.gc.ca/NSERC-CRSNG/Reports-Rapports/audits-verifications/index_eng.asp
iv: Government of Canada, Innovation for a better Canada, ![]() https://www.ic.gc.ca/eic/site/062.nsf/eng/home
https://www.ic.gc.ca/eic/site/062.nsf/eng/home
v: Government of Canada, Results, Policy on, ![]() https://www.ic.gc.ca/eic/site/062.nsf/eng/home
https://www.ic.gc.ca/eic/site/062.nsf/eng/home
vi: Natural Sciences and Engineering Research Council of Canada, Promoscience, http://www.nserc-crsng.gc.ca/Promoter-Promotion/PromoScience-PromoScience/Index_eng.asp
vii: Government of Canada, Science Odyssey 2016, ![]() http://www.science.gc.ca/eic/site/063.nsf/eng/h_97234.html
http://www.science.gc.ca/eic/site/063.nsf/eng/h_97234.html
viii: Science Literacy Week, ![]() http://scienceliteracy.ca/learn/
http://scienceliteracy.ca/learn/
ix: Natural Sciences and Engineering Research Council of Canada, STEAM Horizon Award, http://www.nserc-crsng.gc.ca/Students-Etudiants/UG-PC/STEAM-STIAM_eng.asp
x: Natural Sciences and Engineering Research Council of Canada, Aboriginal Ambassadors in the Natural Sciences and Engineering Award, http://www.nserc-crsng.gc.ca/Students-Etudiants/Aboriginal-Autochtones_eng.asp
xi: German Research Foundation, Deutsche Forschungsgemeinschaft, ![]() http://www.dfg.de/en/research_funding/programmes/coordinated_programmes/research_training_groups/international_rtg/index.html
http://www.dfg.de/en/research_funding/programmes/coordinated_programmes/research_training_groups/international_rtg/index.html
xii: Natural Sciences and Engineering Research Council of Canada, Collaborative Research and Training Experience Program, http://nserc-crsng.gc.ca/Professors-Professeurs/Grants-Subs/CREATE-FONCER_eng.asp
xiii: Natural Sciences and Engineering Research Council of Canada, Discovery Grants Program http://www.nserc-crsng.gc.ca/Professors-Professeurs/FinancialAdminGuide-GuideAdminFinancier/AdminMatters-QuestionAdmin_eng.asp
xiv: Natural Sciences and Engineering Research Council of Canada, Gender Summit 11: Program at a glance, http://www.nserc-crsng.gc.ca/Media-Media/ProgramNewsDetails-NouvellesDesProgrammesDetails_eng.asp?ID=901
xv: Natural Sciences and Engineering Research Council of Canada, College and Community Innovation Program – Technology Access Centres Grants, http://www.nserc-crsng.gc.ca/Professors-Professeurs/RPP-PP/TAC-ECAT_eng.asp
xvi: Natural Sciences and Engineering Research Council of Canada, Plans, Priorities and Performance, http://www.nserc-crsng.gc.ca/NSERC-CRSNG/Reports-Rapports/plans-plans_eng.asp
xvii: TBS InfoBase, ![]() https://www.tbs-sct.gc.ca/ems-sgd/edb-bdd/index-eng.html#start
https://www.tbs-sct.gc.ca/ems-sgd/edb-bdd/index-eng.html#start
xviii: Government of Canada, ![]() http://open.canada.ca/en/suggested-datasets
http://open.canada.ca/en/suggested-datasets
xix: Open Government, ![]() http://open.canada.ca/en.
http://open.canada.ca/en.
xx: Public Accounts of Canada 2017, ![]() http://www.tpsgc-pwgsc.gc.ca/recgen/cpc-pac/index-eng.html
http://www.tpsgc-pwgsc.gc.ca/recgen/cpc-pac/index-eng.html
xxi: Whole-of-government framework, ![]() https://www.tbs-sct.gc.ca/ems-sgd/edb-bdd/index-eng.html#tag-nav/~(current_branch~'GOCO~sort_key~'name~sort_direction~'asc~open_nodes~(~'tag_SA0001~'tag_SA9999~'tag_SA0002~'tag_SA0003~'tag_SA0004~'tag_SA0005))
https://www.tbs-sct.gc.ca/ems-sgd/edb-bdd/index-eng.html#tag-nav/~(current_branch~'GOCO~sort_key~'name~sort_direction~'asc~open_nodes~(~'tag_SA0001~'tag_SA9999~'tag_SA0002~'tag_SA0003~'tag_SA0004~'tag_SA0005))
xxii: Natural Sciences and Engineering Research Act ![]() http://laws.justice.gc.ca/eng/acts/N-21/page- 1.html#docCont
http://laws.justice.gc.ca/eng/acts/N-21/page- 1.html#docCont
xxiii: Report on Federal Tax Expenditures, ![]() http://www.fin.gc.ca/purl/taxexp-eng.asp
http://www.fin.gc.ca/purl/taxexp-eng.asp