Departmental Performance Report 2014-15
Table of Contents
Section I: Organizational Expenditure Overview
- Organizational Profile
- Organizational Context
- Strategic Outcome and Program Alignment Architecture
- Organizational Priorities
- Risk Analysis
- Actual Expenditures
- Alignment of Spending With the Whole-of-Government Framework
- Departmental Spending Trend
- Expenditures by Vote
Section II: Analysis of Programs by Strategic Outcome
- Program 1.1 - People: Research, Talent
- Sub-program 1.1.1: Science and Engineering Promotion
- Sub-program 1.1.2: Scholarships and Fellowships
- Sub-program 1.1.3: Alexander Graham Bell Canada Graduate Scholarships
- Sub-program 1.1.4: Vanier Canada Graduate Scholarships
- Sub-program 1.1.5: Banting Postdoctoral Fellowships
- Sub-program 1.1.6: Canada Research Chairs
- Sub-program 1.1.7: Canada Excellence Research Chairs
- Program 1.3 - Innovation: Research Partnerships
- Sub-program 1.3.1: Research in Strategic Areas
- Sub-program 1.3.2: Industry-driven Collaborative Research and Development
- Sub-program 1.3.3: Networks of Centres of Excellence
- Sub-program 1.3.4: Training in Industry
- Sub-program 1.3.5: Commercialization of Research
- Sub-program 1.3.6: College and Community Innovation
Section III: Supplementary Information
- Financial Statements Highlights
- Financial Statements
- Supplementary Information Tables
- Tax Expenditures and Evaluations
Section IV: Organizational Contact Information
Ministers' Message
We are pleased to report on the Natural Sciences and Engineering Research Council of Canada's key activities in 2014-15.
Our overarching goals within the Innovation, Science and Economic Development portfolio are to help Canadian businesses grow, innovate and export so that they can spur economic development and create good quality jobs and wealth for Canadians in all regions across the country; to help small businesses grow through trade and innovation; to promote increased tourism to Canada; to promote and support scientific research and the integration of scientific considerations in our investment and policy choices. We are committed to working closely with colleagues and stakeholders from all of these diverse fields to achieve these objectives.
We are pleased to present the 2014-15 Departmental Performance Report for the Natural Sciences and Engineering Research Council of Canada (NSERC).

The Honourable Navdeep Bains
Minister of Innovation, Science and Economic Development

The Honourable Kirsty Duncan
Minister of Science

The Honourable Bardish Chagger
Minister of Small Business and Tourism
Section I: Organizational Expenditure Overview
Organizational Profile
Minister of Innovation, Science and Economic Development
The Honourable Navdeep Bains, P.C., M.P.
- The Honourable James Moore, P.C., M.P. (responsible Minister for 2014-15)
Minister of Science
The Honourable Kirsty Duncan, P.C., M.P.
Minister of Small Business and Tourism
The Honourable Bardish Chagger, P.C., M.P.
Institutional Head
Dr. B. Mario Pinto, (President) of NSERC
Ministerial Portfolio
Industry (portfolio name for 2014-15)
Enabling Instrument ![]() Natural Sciences and Engineering Research Council Acti
Natural Sciences and Engineering Research Council Acti
Year of Incorporation / Commencement: May 1, 1978
Note: In November 2015, the Department's name was changed to Innovation, Science and Economic Development Canada.
Organizational Context
Raison d'être
The Natural Sciences and Engineering Research Council of Canada (NSERC) is a key actor in making Canada a leading country of discovery and innovation. NSERC aims to maximize the value of public investments in research and development (R&D) and to advance the prosperity and quality of life of all Canadians.
In today's highly competitive global economy, NSERC plays a central role in supporting Canada's innovation ecosystem. NSERC supports research that benefits all Canadians. By connecting this innovative research to industry through its partnership initiatives, NSERC also makes it easier for the private sector to collaborate with academia and access the wealth of resources Canada's first-rate academic system has to offer.
Canada's future discoverers and innovators can realize their full potential with the support of NSERC's scholarships and fellowships programs, along with funding provided through discovery and partnership awards.
NSERC is also actively working to enhance the profile of Canadian research through national and international promotional activities and by connecting with industry.
Responsibilities
NSERC is a departmental corporation of the Government of Canada created in 1978. It is funded directly by Parliament and reports to it through the Minister of Industry. NSERC's Council is composed of a President and up to 18 other distinguished members selected from the private and public sectors. NSERC's President is the Chief Executive Officer. The elected Vice-President is the Chair of the Council and of its Executive Committee. NSERC's Council is advised on policy matters by various standing committees. Funding decisions are made by the President, or designate, on the basis of recommendations made by peer review committees. The functions of NSERC, based on the authority and responsibility assigned to it under the Natural Sciences and Engineering Research Council Act (1976-1977, c.24), are to:
- promote and assist research in the natural sciences and engineering, other than the health sciences; and
- advise the Minister in respect of such matters relating to such research as the Minister may refer to the Council for its consideration.
NSERC Governance Structure

Strategic Outcome and Program Alignment Architecture
1.0 Canada is a world leader in advancing, connecting and applying new knowledge in natural sciences and engineering.
- 1.1 - People: Research, Talent
- 1.2 - Discovery: Advancement of Knowledge
- 1.2.1: Discovery Research
- 1.2.2: Research Equipment and Resources
- 1.3 - Innovation: Research Partnerships
- 1.4 - Internal Services
*Programs involving more than one federal granting agency
Organizational Priorities
NSERC's role is to make strategic investments in people, discovery and innovation to increase Canada's scientific and technological capabilities for the benefit of all Canadians. NSERC invests in people by supporting postsecondary students, graduate students, researchers, and postdoctoral fellows in their advanced studies. NSERC promotes discovery by funding research conducted by postsecondary professors. NSERC fosters innovation by encouraging Canadian companies to participate and invest in postsecondary research and training. The vast majority of NSERC's expenditures are in areas that fall under the science and technology priorities established by the federal government.
| Priority | Type 1 | Strategic Outcome |
|---|---|---|
| People Advantage | On-going |
Canada is a world leader in advancing, connecting and applying new knowledge in natural sciences and engineering. |
| Summary of Progress | ||
|
What progress has been made toward this priority?
|
||
| Priority | Type | Strategic Outcome |
|---|---|---|
| Knowledge Advantage | On-going |
Canada is a world leader in advancing, connecting and applying new knowledge in natural sciences and engineering. |
| Summary of Progress | ||
|
What progress has been made toward this priority?
|
||
| Priority | Type | Strategic Outcome |
|---|---|---|
| Innovation Advantage | On-going |
Canada is a world leader in advancing, connecting and applying new knowledge in natural sciences and engineering. |
| Summary of Progress | ||
|
What progress has been made toward this priority? NSERC released a final report on its Strategy for Partnerships and Innovation (SPI) in December 2014. The Strategy successfully built on NSERC's significant expertise with the foundational and applied research done by the university and college experts and leveraged it to show companies how they can benefit from working with universities and colleges. NSERC has achieved concrete results enhancing R&D and business innovation in Canada. Since 2009, when the Strategy was launched, SPI has realized the following outcomes:
NSERC plans to renew its Strategy for Partnerships and Innovation as part of its broader strategic renewal through NSERC 2020. |
||
| Priority | Type | Strategic Outcome |
|---|---|---|
| Accountability | On-going |
Canada is a world leader in advancing, connecting and applying new knowledge in natural sciences and engineering. |
| Summary of Progress | ||
|
What progress has been made toward this priority? NSERC continued to work together with Social Sciences and Humanities Research Council to implement the new Research Portal and Canadian Common CV. This collaboration is designed to fulfill NSERC's commitments to harmonize and improve programs, activities and policies, in order to provide the highest level of service and accountability to the research community in Canada. |
||
| Priority | Type | Strategic Outcome |
|---|---|---|
| Visibility | On-going |
Canada is a world leader in advancing, connecting and applying new knowledge in natural sciences and engineering. |
| Summary of Progress | ||
|
What progress has been made toward this priority? NSERC regularly showcases and promotes the success of our funded scientists and engineers through a variety of channels including events, website, social media and more. NSERC hosts over 200 events across the country each year, providing our researchers with the opportunity to showcase their work to a variety of stakeholders, including key opinion leaders, partners and the public. We also work closely with other organizations to lead targeted events on Parliament Hill that focus on key themes. Most recently, NSERC hosted an event showcasing the work of women scientists and engineers to parliamentarians with the support of Engineers Canada. One of signature events each year is our Top Researchers Awards. Held at Rideau Hall, this high profile event features Canada's top scientists and engineers who are recognized for their success by the Governor General, the minister of State (Science and Technology) and the research community as a whole. This event generates widespread media coverage in outlets across the country. We also connect regularly with universities and colleges to generate media coverage awareness of the important discoveries and innovations that are emerging from Canada's pool of research talent. Overall, we continue to work both internally and externally to highlight and celebrate the scientists and engineers who make lasting impacts on our on society and the quality of life of Canadians. |
||
Risk Analysis
The key risks identified by NSERC for 2014-15 are highlighted below:
| Risks | Risk Response Strategy | Link to Program Alignment Architecture |
|---|---|---|
| Implementing Information Technology Innovation The risk that the organizational investments in information technology are not leveraged or adequately resourced. |
In 2014-15, NSERC established a new governance framework to streamline decision-making and clarify roles and responsibilities to implement the Research Portal. NSERC implemented business process harmonization as part of the phased-in approach to adjust the Research Portal release strategy. |
S.O.1 |
|
Managing Business Transformation |
NSERC is engaging in new training and change management initiatives that address specific risks associated with business transformation projects that are underway. NSERC is putting in place a new communications framework to anticipate and manage changes associated with business transformations |
|
|
Stakeholder Management |
In 2014-15, NSERC consulted stakeholders at 19 town hall meetings across Canada and through online surveys to develop NSERC's new Strategic Plan for 2015-20, to begin to develop and implement an action plan for changes to current policies and programs. In 2014-15, NSERC held 13 community engagement visits at university campuses and 2 webinars. |
Actual Expenditures
| 2014-15 Main Estimates | 2014-15 Planned Spending | 2014-15 Total Authorities Available for Use | 2014-15 Actual Spending (authorities used) | Difference (actual minus planned) |
|---|---|---|---|---|
| $1,063,174,249 | $1,063,174,249 | $1,089,245,893 | $1,085,445,456 | $22,271,207 |
| 2014-15 Planned | 2014-15 Actual | 2014-15 Difference (actual minus planned) |
|---|---|---|
| 378 | 383 | 5 |
| Strategic Outcome, Programs and Internal Services | 2014-15 Main Estimates | 2014-15 Planned Spending | 2015-16 Planned Spending | 2016-17 Planned Spending | 2014-15 Total Authorities Available for Use | 2014-15 Actual Spending (authorities used) | 2013-14 Actual Spending (authorities used) | 2012-13 Actual Spending (authorities used) |
|---|---|---|---|---|---|---|---|---|
| Strategic Outcome: 1. Canada is a world leader in advancing, connecting and applying new knowledge in the natural sciences and engineering. | ||||||||
| 1.1 People: Research Talent | $276,073,435.00 | $276,073,435.00 | $287,316,237.00 | $287,460,422.00 | $281,331,506.00 | $272,162,729.00 | $268,221,394.00 | $271,422,544.00 |
| 1.2 Discovery: Advancement of Knowledge | $394,168,765.00 | $394,168,765.00 | $403,374,332.00 | $402,680,789.00 | $407,067,408.00 | $417,812,704.00 | $404,299,452.00 | $430,509,978.00 |
| 1.3 Innovation: Research Partnerships | $369,062,488.00 | $369,062,488.00 | $372,473,817.00 | $371,237,543.00 | $374,634,239.00 | $371,301,195.00 | $370,061,947.00 | $346,895,745.00 |
| Subtotal | $1,039,304,688.00 | $1,039,304,688.00 | $1,063,164,386.00 | $1,061,378,754.00 | $1,063,033,153.00 | $1,061,276,628.00 | $1,042,582,793.00 | $1,048,828,267.00 |
| Internal Services Subtotal | $23,869,561.00 | $23,869,561.00 | $23,405,939.00 | $23,371,255.00 | $26,212,740.00 | $24,168,828.00 | $24,096,237.00 | $27,152,242.00 |
| Total | $1,063,174,249.00 | $1,063,174,249.00 | $1,086,570,325.00 | $1,084,750,009.00 | $1,089,245,893.00 | $1,085,445,456.00 | $1,066,679,030.00 | $1,075,980,509.00 |
Alignment of Spending With the Whole-of-Government Framework
Alignment of 2014-15 Actual Spending With the ![]() Whole-of-Government Frameworkii (dollars)
Whole-of-Government Frameworkii (dollars)
| Strategic Outcome | Program | Spending Area | Government of Canada Outcome | 2014-15 Actual Spending |
|---|---|---|---|---|
| Strategic Outcome 1.0: Canada is a world leader in advancing, connecting and applying new knowledge in the natural sciences and engineering. | 1.1 People: Research Talent |
Economic Affairs | An innovative and knowledge-based economy | $272,162,729.00 |
| 1.2 Discovery: Advancement of Knowledge | Economic Affairs | An innovative and knowledge-based economy | $417,812,704.00 | |
| 1.3 Innovation: Research Partnerships | Economic Affairs | An innovative and knowledge-based economy | $371,301,195.00 | |
| Total | $1,085,445,456.00 |
| Spending Area | Total Planned Spending | Total Actual Spending |
|---|---|---|
| Economic Affairs | $1,063,174,249.00 | $1,085,445,456.00 |
| Social Affairs | N/A | N/A |
| International Affairs | N/A | N/A |
| Government Affairs | N/A | N/A |
Departmental Spending Trend

Expenditure Profile Explanation - NSERC
The change in spending from 2012-13 to 2013-14 reflects ongoing savings achieved through improved efficiency, partially offset by funds provided to augment the College and Community Innovation Program to support for partnerships between businesses and academic researchers (Budget 2013). Variations in the spending profile since 2013-14 are largely due to additional funds to augment support for advanced research in the natural sciences and engineering (Budget 2014).
We observe a reduction in 2017-18 because planned spending does not include future competitions of tri-Agency initiatives, such as the Canada Excellence Research Chairs and Centres of Excellence for Commercialization and Research. Funds for these initiatives are appropriated following each competition based on the successful applicants' requirements.
The temporary funding identified as sunsetting programs in the graph above consists of funds to establish the Canada-India Research Centre of Excellence (Budget 2011), to support excellence in climate change and atmospheric research at Canadian postsecondary institutions (Budget 2011) and funds transferred from the National Research Council for the administration of the Canadian Light Source.
The Canada First Research Excellence Fund (Budget 2014), and Budget 2015 announcements are not included in planned spending.
Expenditures by Vote
For information on Natural Sciences and Engineering Research Council of Canada's organizational voted and statutory expenditures, consult the ![]() Public Accounts of Canada 2015,iii which is available on the Public Works and
Public Accounts of Canada 2015,iii which is available on the Public Works and ![]() Government Services Canada websiteiv.
Government Services Canada websiteiv.
Section II: Analysis of Programs by Strategic Outcome
Strategic Outcome
Canada is a world leader in advancing, connecting and applying new knowledge in the natural sciences and engineering.
Program 1.1: People: Research Talent
Description
This program supports the attraction, retention and development of highly qualified people in the natural sciences and engineering in Canada through Chairs programs, fellowships, scholarships and stipends. These activities are essential to building the human capital required to enable a strong, globally competitive research and innovation system in Canada. Researchers, students and young people benefit from the grant funding which supports postsecondary university research as well as some outreach activities at universities, museums, science centres, and community based organizations.
| 2014-15 Main Estimates | 2014-15 Planned Spending | 2014-15 Total Authorities Available for Use | 2014-15 Actual Spending (authorities used) | 2014-15 Difference (actual minus planned) |
|---|---|---|---|---|
| $276,073,435.00 | $276,073,435.00 | $281,331,506.00 | $272,162,729.00 | -$3,910,706.00 |
| 2014-15 Planned | 2014-15 Actual | 2014-15 Difference (actual minus planned) |
|---|---|---|
| 33 | 35 | 2 |
| Expected Results | Performance Indicators | Targets | Actual Results |
|---|---|---|---|
| Canada's workforce has the required talented and skilled researchers in natural sciences and engineering. | Total researchers per thousand employed. | 8th | 4th (See Fig. 2.1) |
| Percentage difference in unemployment rate for occupations in natural sciences and engineering vs. national unemployment rate. | 1% | 3.9% (See Fig. 2.2) | |
| Number of earned doctoral degrees in natural sciences and engineering per capita. | 15th | 6th (See Fig. 2.3) |
Performance Analysis and Lessons Learned
Canada is performing well on the three indicators chosen to highlight NSERC's People: Research Talent investments. Canada ranks 4th in the total number of researchers per thousand employed relative to other G20 countries (Figure 2.1). The unemployment rate for occupations in the natural sciences and engineering in 2014 was less than half the general unemployment rate, (Figure 2.2). At more than 1.3 million, the natural science and engineering labour force has also been the fastest growing occupational group in Canada over the past 20 years. Furthermore, the average annual salaries for natural sciences and engineering professions are 32% above the national average for all occupations. There has been steady growth in the number of earned doctorates produced by Canadian universities and this is reflected in improving international rankings. Canada now ranks 6th in the G20 in doctoral degree output per capita in the natural sciences and engineering for 2010. (see Figure 2.3)
NSERC enhanced its parental leave policy for students and fellows by increasing the duration of parental leave supplements from four to six months, therefore harmonizing with the Canadian Institutes of Health Research's policy. This change reflects an increased emphasis by the Council on gender equity as part of its programming. The three granting agencies have also prepared an eight-point Gender Equity Action plan, to be implemented by each of the agencies in 2015-16 and beyond.
The Collaborative Research and Training Experience (CREATE) Program has been growing for the past six years and has now reached steady state where it will support 15 to 20 new initiatives per year.
Figure 2.1
Number of Researchers Per Thousand Employment, G20 Countries, 2012 or Most Recent Year

Source: OECD, UNESCO. Data not available for Saudi Arabia.
Figure 2.2
Unemployment Rates for General Population and Natural Scientists and Engineers (NSE)
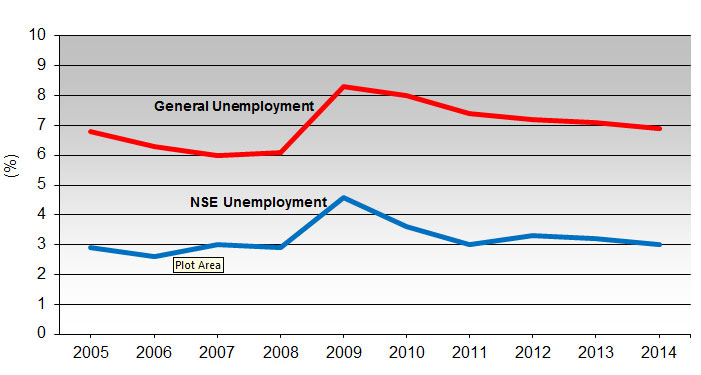
Source: Statistics Canada
Fiture 2.3
Doctoral Degrees Granted per Capita, G20 Countries, 2010 or Most Recent Year
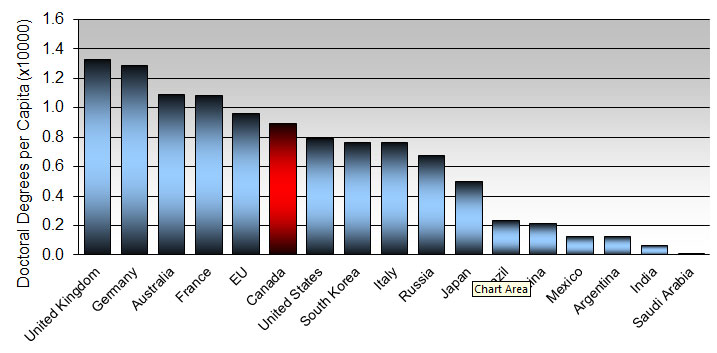
Source: National Science Foundation (U.S.), OECD. Data not available for Indonesia, South Africa and Turkey.
Dalhousie professor's chemical models now widely used in research and industry
Dr. Axel Becke, Gerhard Herzberg Gold Medal for Science and Engineering winner in 2014
Scientists and engineers around the world rely on Dr. Axel Becke's ground-breaking chemical theories and computational methods to advance numerous sectors ranging from drug discovery to cleaner energy. It's no wonder the Dalhousie University chemistry professor is one of the most frequently cited researchers in the world.
The Killam Chair in Computational Science is credited with turning the "density-functional" theory of electronic motions in atoms, molecules, and solids into an accurate and practical modeling tool. Early density-functional theory calculations in the 1960's and 70's were only suitable to describe metals. Refinements by Dr. Becke since the mid 1980's, however, have enabled accurate density-functional theory modeling of everything from simple molecules to complex biological systems and next-generation materials.
Since all matter depends on the motions of electrons, the applications of density-functional theory are endless: chemistry, biochemistry, nanotechnology, surface science, materials science—the list goes on. As a result, Dr. Becke's work has been cited 100,000 times so far. Two of his papers rank among the Top 100 most-cited papers of all time, one in the top 10 at #8, and another at #25 [Nature 514, 550 (2014)].
Dr. Becke's methods have been incorporated into software packages worldwide and are heavily used by scientists, engineers and companies. Density-functional theory is now the most popular computational approach to the prediction of structures, energies, properties, and mechanisms in physics and chemistry. Its popularity earned theoretical physicist Walter Kohn, who conceived the foundations of density-functional theory in 1964-65, the 1998 Nobel Prize in Chemistry. This was in large part an outcome of Dr. Becke's enhancements of the theory.
Sub-Program 1.1.1: Science and Engineering Promotion
Description
This sub-program stimulates the public's interest in science, mathematics, and engineering and encourages the next generation of students to consider careers in these fields, helping to ensure that Canada has an ongoing supply of future discoverers and innovators. NSERC awards grants to support activities of community-based organizations, museums, science centres and universities that stimulate the interest of young people and students and improve school performance in science and mathematics, notably under-represented groups in natural sciences and engineering, such as women and Aboriginals. In addition, NSERC offers several prizes that recognize and highlight Canadian achievements in training, research and innovation. This sub program uses funding from the following transfer payment: Grants and Scholarships.
| 2014-15 Planned Spending | 2014-15 Actual Spending | 2014-15 Difference (actual minus planned) |
|---|---|---|
| $6,315,892.00 | $6,411,318.00 | $95,426.00 |
| 2014-15 Planned | 2014-15 Actual | 2014-15 Difference (actual minus planned) |
|---|---|---|
| 1 | 1 | 0 |
| Expected Results | Performance Indicators | Targets | Actual Results |
|---|---|---|---|
| The next generation of university students select the natural sciences and engineering as a field of study. | Percentage growth in bachelor's enrolment in natural sciences and engineering at Canadian universities. | 1% | 5.3% (see Figure 2.4) |
| Percentage of science promotion projects that successfully complete the planned activity. | 80% | 89% |
Performance Analysis and Lessons Learned
Bachelor's enrolment in the natural sciences and engineering is currently at an all-time high and grew by 5.3% in 2012-13 as compared to the previous year. Increasing participation of youth in university education, favourable demographics, and NSERC's PromoScience awards have all helped to push NSE bachelor's enrolment ever higher. End of grant reporting also indicates that 89% of PromoScience awards have been successful in meeting the expectations of the planned activities.
PromoScience continues to support organizations that promote the natural sciences and engineering to Canada's young people, with an increased emphasis on proposals focusing on groups that are traditionally under-represented in scientific and engineering careers. The 2014 PromoScience competition attracted 157 eligible applications with funding requests totaling $14.6 million. The Selection Committee recommended $3.6 million over the next three years to 66 organizations, representing a 42% success rate and a 25% funding rate. Of the 66 awards made, 9 grants were awarded to organizations that specifically focus their outreach to girls as well and 12 grants were awarded to organizations that specifically focus their outreach to Aboriginal youth.
Figure 2.4
Bachelor's Enrolment in Canada in the Natural Sciences and Engineering

Source : Statistics Canada
Fostering a Lifelong Interest in Science
Huntsman Marine Sciences Centre
The Centre has been an active steward of the ocean resource by finding ways to educate citizens about the oceans for the past 45 years. The education programs of the Huntsman have been pioneering; knowledge-based activities that have influenced the development of highly qualified personnel in the marine sciences and the oceans industry sector of the Canadian economy. The goal of the Huntsman Education Department is to foster a lifelong interest in science by showing students that it can be fun to learn scientifically through hands-on activities. The hands-on school programs have engaged over 42,000 students - ranging from elementary school age to university graduate level. These programs are designed to make connections with school curricula. They balance field excursions (including boat trips) with lab activities; most are multi-day and include room and board on campus. Funding in the amount of $114,900 was awarded through the PromoScience Program to the Huntsman Marine Science Centre to help support new hands-on experiential learning opportunities for school students.
Women in Scholarship, Engineering, Science and Technology (WISEST) at the University of Alberta
WISEST promotes the participation of underrepresented groups, including women and Aboriginal people, in Science, Engineering and Technology (SET) through education, outreach and mentorship. Funding in the amount of $210,000 was awarded through the PromoScience Program to WISEST in support of the six-week WISEST Summer Research Program (SRP), the one-day SET Conference and the Teacher Appreciation Day. The program objectives are to enhance the interest and participation of young women from urban, rural and Aboriginal communities primarily in Western Canada in natural sciences and engineering. NSERC funding will specifically support rural and Aboriginal women from high school by providing SET Conference registration fees, travel and living expenses to attend the SET Conference and SRP, student wages in the SRP, supervision and staff costs to run SET and SRP, targeted advertisement and media communications and the delivery of an extensive SRP Teacher Appreciation Day program. WISEST directs its attention and resources to high-school students in the belief that meaningful exposure at this stage of education will have a critical, positive impact for upcoming academic choices. WISEST students, in turn, become inspirational role models for peers and siblings. High school students try hands-on lab activities, meet university students and learn what it is like to be a SET student, talk with women in SET-based careers from academia, industry and government about their career path, gain insight into different career paths and the University programs that will lead to desired career options. To provide regular career and peer support, students participate in weekly seminars that include mentorship, tours of other research facilities both off and on campus, exposure to science and engineering jobs in industry and development of research-based and personal skills including scientific writing and networking. Students present their scientific research posters to the broad WISEST community at the Celebration of Research.
Sub-program 1.1.2: Scholarships and Fellowships
Description
This sub-program supports a significant number of students at various stages of their university studies. At the undergraduate level, support for 16-week research internships in universities aims to stimulate students' interest in research in natural sciences and engineering and encourage them to undertake graduate studies and pursue a research career in these fields. At the postgraduate level, students earn a master's or doctoral degree in an academic or industrial setting or in a foreign institution. NSERC Fellowships provide support to promising doctoral graduates to further their research training in Canada or abroad. This program uses funding from the following transfer payments: Grants and Scholarships.
| 2014-15 Planned Spending | 2014-15 Actual Spending | 2014-15 Difference (actual minus planned) |
|---|---|---|
| $77,554,283.00 | $76,220,214.00 | -$1,334,069.00 |
| 2014-15 Planned | 2014-15 Actual | 2014-15 Difference (actual minus planned) |
|---|---|---|
| 19 | 20 | 1 |
| Expected Results | Performance Indicators | Targets | Actual Results |
|---|---|---|---|
| Bachelors, Masters, and Doctoral students gain research experience in natural sciences and engineering that provides them with a competitive advantage in their careers. | Percentage of student population in natural sciences and engineering supported (directly or indirectly) by NSERC. | 25% | 37% |
| Percentage of students supported that are motivated to pursue further studies or training. | 20% | 28% (see Figure 2.5) | |
| Percentage of postgraduate students and postdoctoral fellows supported engaged in R&D in their jobs (7 to 9 years after their award). | 50% | 57% / 93% (see Figure 2.6) |
Performance Analysis and Lessons Learned
NSERC supports a significant proportion of the postgraduate students in the NSE in Canadian universities. In 2012-13, NSERC supported 17,200 master's and PhD students compared to enrolment of 46,900 students (or 37% of the postgraduate student population). One way NSERC stimulates postgraduate enrolment in the NSE in Canada is by offering Undergraduate Student Research Awards that allow Canadian undergraduate students to gain work experience in a university lab. Post award exit surveys reveal that these recipients are highly motivated and 75%t plan to pursue postgraduate education. The experience helped to encourage more than 28% of the recipients to consider postgraduate studies as compared to their intentions before the award (see Figure 2.5).
NSERC routinely surveys past scholarship winners (nine years after their award) and postdoctoral fellows (seven years after their award) to get a sense of their early career outcomes. Trained and educated for a career in R&D, former NSERC scholars (57%) and fellows (93%) are working in a R&D position (see Figure 2.6).
Other highlights for the year include:
- In 2014-15, NSERC continued the evaluation of its scholarships and fellowships training initiatives, including the Collaborative Research and Training Experience opportunity. The evaluation results will be available in 2015.
- Fifteen new Collaborative Research and Training Experience grants, which support professional skills development of trainees, were awarded in 2014-15. Six of these grants were in the industrial stream of this program, which requires industrial involvement in the training program and internships for trainees. All but three of the awarded grant proposals included international involvement, including two awarded through strategic agreements established with Brazil's funding agency and one through strategic agreements established with Germany's funding agency.
- In 2014-15, NSERC made 180 offers to applicants for Postdoctoral Fellowships (PDFs). This number is up from the 130 PDF offers made in 2014. NSERC will continue to fund these fellowships at an increased rate as budgets permit. In addition, NSERC supports approximately 930 fellows through its CREATE and Discovery Grant Programs, along with about 8,000 graduate students.
- In 2014-15, NSERC increased the value of a PDF by $5,000 per year: from $40,000 to $45,000. This increase applied to all fellows holding a PDF as a result of the 2014 Competition, and to all future recipients of a PDF.
- In September 2014, NSERC launched a new opportunity for Canadian postdoctoral fellows to pursue their research in China in a pilot initiative between NSERC and the National Natural Science Foundation of China (NSFC). With this agreement, NSERC is providing up to ten supplements of $10,000 per year for two years to successful NSERC Postdoctoral Fellowship (PDF) applicants interested in pursuing their research in China, while NSFC will provide funding for research expenses to eligible professors in China who host an NSERC PDF applicant.
- In November 2014, NSERC announced that L'Oréal Canada, in collaboration with the Canadian Commission for UNESCO, will offer one $5,000 supplement to a woman scientist or engineer involved in promising research projects who has been awarded an NSERC Postdoctoral Fellowship.
Figure 2.5
Percentage of NSERC Undergraduate Student Research Award (USRA) Holders Who Were Motivated to Pursue Postgraduate Studies
Source : NSERC University USRA exit surveys.
Figure 2.6
Percentage of Former NSERC Scholars (9 years after award) and Postdoctoral Fellows (7 years after award) Working in R&D

Source : NSERC Career surveys.
Sub-Program 1.1.3: Alexander Graham Bell Canada Graduate Scholarships
Description
This sub-program provides financial support to outstanding eligible scholars pursuing Master's or Doctoral studies in a Canadian university. This program is necessary to ensure a reliable supply of highly qualified personnel to meet the needs of Canada's knowledge economy. Supplementary funding is available in the form of Foreign Study Supplements to select recipients of Canada Graduate Scholarships to build global linkages and international networks through the pursuit of exceptional, short-term research experiences at research institutions outside of Canada. This program uses funding from the following transfer payment: Canada Graduate Scholarships.
| 2014-15 Planned Spending | 2014-15 Actual Spending | 2014-15 Difference (actual minus planned) |
|---|---|---|
| $43,608,026.00 | $43,622,752.00 | $14,726.00 |
| 2014-15 Planned | 2014-15 Actual | 2014-15 Difference (actual minus planned) |
|---|---|---|
| 10 | 11 | 1 |
| Expected Results | Performance Indicators | Targets | Actual Results |
|---|---|---|---|
| Increased capacity to supply highly qualified personnel to the academic, public and private sectors. | Percentage of Canada Graduate Scholarship students supported completing their degree. | 90% | 99% |
| Time to degree completion of Doctoral recipients of a Canada Graduate Scholarship. | < 6 years | 4.8 years |
Performance Analysis and Lessons Learned
NSERC's survey of former Canada Graduate scholars indicates that 99% of recipients completed their degree for which they received funding versus a national average completion rate of 90%. From the same survey it was also determined that recipients complete their doctoral degree in 4.8 years versus the national average of 5.2 years (Statistics Canada Earned Doctorate Survey), or 8% sooner.
Following a consultation with the community, the delivery of the Canada Graduate Scholarship - Master's Program component has been harmonized among the three granting agencies and the first awards delivered under the new process were made in April 2014. Planning has started for the harmonization of the Canada Graduate Scholarship-doctoral component.
Sub-Program 1.1.4: Vanier Canada Graduate Scholarships
Description
This sub-program provides financial support to students who have achieved exceptional success in their studies and who demonstrate high potential in the pursuit of a doctoral program in a Canadian university. Both Canadian and international students are eligible for Vanier Canada Graduate Scholarships. This program helps attract and retain world-class doctoral students by supporting individuals who demonstrate a high standard of scholarly achievement in graduate studies, as well as leadership skills. A high-level steering committee, assisted by an international review committee ensures that the most intelligent and gifted students are chosen as recipients of the scholarships. Awards allow students to fully concentrate on their studies and work with the best research mentors in their chosen field in Canada. This program uses funding from the following transfer payment: Vanier Canada Graduate Scholarships.
| 2014-15 Planned Spending | 2014-15 Actual Spending | 2014-15 Difference (actual minus planned) |
|---|---|---|
| $8,551,597.00 | $8,313,341.00 | -$238,256.00 |
| 2014-15 Planned | 2014-15 Actual | 2014-15 Difference (actual minus planned) |
|---|---|---|
| 2 | 2 | 0 |
| Expected Results | Performance Indicators | Targets | Actual Results |
|---|---|---|---|
| Compete worldwide for premier doctoral students to build world-class research capacity in Canada. | Expert review of quality of the pool of applicants as measured by percent of fundable applications for a given competition year. | 40% | 35% (see Figure 2.8) |
| Number of international students who were awarded a Vanier Canada Graduate Scholarship | 50 | 46 (see Figure 2.9) |
Performance Analysis and Lessons Learned
As shown in Figure 2.7, Canada is an attractive destination for foreign students at the doctoral level (i.e. advanced research programs). The number of foreign doctoral students in the natural sciences and engineering enrolled at a Canadian university is at an all-time high and grew by more than 9% for the latest year-over-year period. At nearly 8,800 students, foreign natural sciences and engineering doctoral enrolment in Canada represents over 40% of the student population at that level.
In 2014-15, the Vanier CGS Program underwent its first evaluation, which was led by CIHR in partnership with NSERC and SSHRC. The evaluation identified some challenges including the program's ability to attract and recruit students from outside of Canada. The evaluation recommended that a portion of nomination allocations be reserved for foreign students moving forward. Changes to the three-year cycle allocation and application processes were also recommended to enable the Vanier CGS awards Program to better meet its objective of attracting and recruiting world-class doctoral students to Canadian universities. CIHR has changed the allocation of the program to an annual quota, and clearer definitions and guidelines were developed with the dissemination to be included in the June 2015 launch. CIHR continues to work on improvements related to the timing of the program and the recruitment of foreign students to the program.
The granting agencies have once again offered 166 Vanier Canada Graduate Scholarships of which 55 are in the natural sciences and engineering and of the scholars, 20 are international researchers. These promising young researchers are positioned to become Canada's next generation of leaders in research excellence.
Figure 2.7
Foreign Student Enrolment at the Doctoral Level in Canada in the Natural Sciences and Engineering

Source : Statistics Canada
Figure 2.8
Percentage of Fundable Applications to Vanier Canada Graduate Scholarships as a Measure of the Quality of the Pool of Applicants
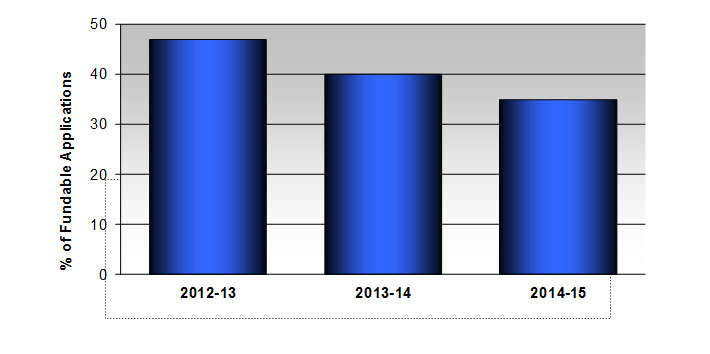
Figure 2.9
Number of International Students Awarded a Vanier Canada Graduate Scholarship

Evaluation of the Vanier Canada Graduate Scholarships (2014-15)
This is the first evaluation of the Vanier CGS Program and was led by the Canadian Institutes of Health Research (CIHR) in partnership with the Natural Sciences and Engineering Research Council of Canada (NSERC) and the Social Sciences and Humanities Research Council of Canada (SSHRC). The evaluation examines the relevance and performance of the program as well as its design and delivery in order to meet Treasury Board requirements for evaluation and inform the renewal of its Terms and Conditions, which expire July 31, 2014.
The Vanier CGS Program has remained a federal government priority since its inception and key informants interviewed noted that the impacts of graduate training are considerable and an important reason for the Government of Canada to support world-class doctoral students. The goals of the Vanier CGS Program align seamlessly with the research capacity building priorities of the three Federal Granting Agencies to attract, train and retain high-quality talent.
Sub-Program 1.1.5: Banting Postdoctoral Fellowships
Description
This sub-program supports postdoctoral researchers from Canada and abroad in order to attract the very best postdoctoral fellows to further their training and carry out research in Canada. Up to 25% of these awards can be held abroad to allow Canadian postdoctoral fellows the opportunity to gain valuable international experience. This program helps reinforce Canada's standing as a global player in research excellence and higher learning and as a destination of choice for the most gifted students and researchers. The high level of support provided ensures that these fellowships are internationally competitive. Awards provide a two year stipend to the recipient.
| 2014-15 Planned Spending | 2014-15 Actual Spending | 2014-15 Difference (actual minus planned) |
|---|---|---|
| $3,632,637.00 | $2,817,050.00 | -$815,587.00 |
| 2014-15 Planned | 2014-15 Actual | 2014-15 Difference (actual minus planned) |
|---|---|---|
| 1 | 1 | 0 |
| Expected Results | Performance Indicators | Targets | Actual Results |
|---|---|---|---|
| Compete worldwide for premier postdoctoral researchers to build world class research capacity in Canada. | Expert review of the quality of the pool of applicants as measured by percent of fundable applications (for a given competition year). | 25% | 22% (see Figure 2.10) |
| Number of international postdoctoral researchers or equivalent who were awarded a Banting Postdoctoral Fellowship. | 22 | 22 (see Figure 2.11) |
Performance Analysis and Lessons Learned
The Performance Measurement Strategy for the program was approved in December 2013. The framework from this strategy will now form the basis for the annual reporting of the program performance and the periodic program evaluations. These will inform whether the candidates selected for Banting Fellowships meet the excellence requirements of the program and indeed go into successful research-related careers.
In 2014-15, the Banting Program awarded fellowships to 22 international post-doctoral researchers, in line with targets for the year. The first evaluation of the program is in progress and is expected to be completed in 2015-16.
Figure 2.10
Percentage of Fundable Applications to Banting Postdoctoral Fellowships as a Measure of the Quality of the Pool of Applicants

Figure 2.11
Number of International Students Awarded a Banting Postdoctoral Fellowship

Sub-Program 1.1.6: Canada Research Chairs
Description
This sub-program provides support to research chairs in the form of salary and research funding to attract and retain some of the world's most accomplished and promising minds. This program assists Canadian universities, together with their affiliated research institutes and hospitals, achieve the highest levels of research excellence and to become world-class research centres in today's global, knowledge-based economy. Eligible nominees are full professors or associate professors and emerging scholars who may range from recent Doctoral graduates to associate professors. National and international researchers can be chair holders.
| 2014-15 Planned Spending | 2014-15 Actual Spending | 2014-15 Difference (actual minus planned) |
|---|---|---|
| $118,211,000.00 | $112,978,054.00 | -$5,232,946.00 |
The variance between planned and actual spending relates to 5 to 10% of chairs not being filled at any given point, due to normal turnover of incumbents.
| 2014-15 Planned | 2014-15 Actual | 2014-15 Difference (actual minus planned) |
|---|---|---|
| N/A* | N/A* | 0 |
*The program is managed by SSHRC.
| Expected Results | Performance Indicators | Targets | Actual Results |
|---|---|---|---|
| World-class research is enhanced in Canadian universities through the attraction and retention of excellent researchers. | Percentage of institutions that found the Canada Research Chairs Program important or very important in their ability to support the existing research teams/ research clusters/ research centres. | 90% | 93% |
Performance Analysis and Lessons Learned
The Canada Research Chairs Program continued to offer support which increased national and international scientific collaboration and helped chair holders keep pace with other Canadian researchers. Through their institutional annual reports, 93% of universities reported that the Chairs Program was important or very important to their ability to support the existing research centres and research clusters, and 81% also indicated that the program was either important or very important to the creation of new research clusters and research centres.
Sub-Program 1.1.7: Canada Excellence Research Chairs
Description
This sub-program offers eligible Canadian degree-granting institutions the opportunity to establish highly remunerated research chairs at their institutions in research areas in one or more of the four priority research areas that are of strategic importance to Canada: environmental sciences and technologies, natural resources and energy, health and related life sciences and technologies, and information and communication technologies. This program is necessary to attract the highest calibre of researchers for Canada's future prosperity. This program uses funding from the following transfer payment: Canada Excellence Research Chairs.
| 2014-15 Planned Spending | 2014-15 Actual Spending | 2014-15 Difference (actual minus planned) |
|---|---|---|
| $18,200,000.00 | $21,800,000.00 | $3,600,000.00 |
The variance reflects 6 additional Research Chairs announced in Budget 2011 for the 2014 competition obtained through the Supplementary Estimates.
| 2014-15 Planned | 2014-15 Actual | 2014-15 Difference (actual minus planned) |
|---|---|---|
| N/A* | N/A* | N/A* |
*The program is managed by SSHRC.
| Expected Results | Performance Indicators | Targets | Actual Results |
|---|---|---|---|
| The attraction of the world's most accomplished researchers to help Canada build a critical mass of expertise in areas of strategic importance to Canada. | Percentage of institutions that have reported significant growth, over the course of the term of the award, in areas of strategic importance to Canada, due to the award. | 75% | 83% |
| Percentage of Chairs that have provided expert advice/opinion to target end-user groups at a moderate/significant level. | 75% | 94% |
Performance Analysis and Lessons Learned
The first evaluation of the Canada Excellence Research Chairs Program since its inception was initiated in 2013-14. The evaluation evidence suggests that the program may represent an effective means to build beneficial relationships with non-academic sectors in the future, and some stakeholders indicated that such partnerships are expected to be developed as programs of research evolve, leading to further benefits. Some early notable examples were observed of the benefits of such relationships (e.g., commercialization of research products, patent applications, creation of new companies, expert advice for the government sector).
Industry partners also identified benefits of working with a Canada Excellence Research Chair, such as a higher return on investment and reduced risk for R&D, as well as greater access to highly qualified personnel that have gained industry-relevant skills. Similarly, government partners noted opportunities for improving economic development in their region, and enhancing decision-making through access to cutting-edge expertise and high-quality research results.
Tri-Agency Evaluation of the Canada Excellence Research Chairs (2014-15)
Launched in 2008, the Canada Excellence Research Chairs (CERC) Program supports Canadian universities in their efforts to build on Canada's growing reputation as a global leader in research and innovation.
The evaluation concluded that the program should be continued for an additional five years. The current context reinforces the need to continue supporting the program to help ensure Canada remains competitive at the global level. Among its most notable achievements, the CERC Program has directly contributed to the attraction and recruitment of world-class researchers in a highly competitive global environment. The program clearly enhanced the research capacity in environmental sciences and technologies, natural resources and energy, health and related life sciences and technologies, and information and communications technologies in host institutions, to the extent that some awards were reported to be "game changers" by the institution. The program has also created benefits for researchers and HQP, leading to positive impacts such as career opportunities and higher-quality research outputs.
Program 1.2 - Discovery: Advancement of Knowledge
Description
This program supports the creation of new knowledge and maintenance of a high quality Canadian-based research capacity in natural sciences and engineering through grants to researchers. The advancement of knowledge generated by these grants is necessary to fuel a strong research and innovation system in Canada that is globally competitive. Academic researchers receive funding to support the timely acceleration of research programs, the purchase or development of research equipment, or the facilitation of effective access to major and unique research resources.
| 2014-15 Main Estimates | 2014-15 Planned Spending | 2014-15 Total Authorities Available for Use | 2014-15 Actual Spending (authorities used) | 2014-15 Difference (actual minus planned) |
|---|---|---|---|---|
| $394,168,765.00 | $394,168,765.00 | $407,067,408.00 | $417,812,704.00 | $23,643,939.00 |
| 2014-15 Planned | 2014-15 Actual | 2014-15 Difference (actual minus planned) |
|---|---|---|
| 50 | 55 | 5 |
| Expected Results | Performance Indicators | Targets | Actual Results |
|---|---|---|---|
| Researchers at Canadian universities advance knowledge in natural sciences and engineering. | Ranking in the per capita output of publications in natural sciences and engineering vs. G20 countries. | 8th | 2nd (see Figure 2.12) |
| Ranking in the number of natural sciences and engineering publications vs. G20 countries. | 9th | 11th (see Figure 2.13) | |
| Average relative citation factor of Canadian publications in natural sciences and engineering vs.G20 countries. | 15th | 7th (see Figure 2.14) |
Performance Analysis and Lessons Learned
One measure of university research is a publication in a scientific or engineering journal. Publications are a good indicator of the immediate outcome of NSERC research funding and can be used to benchmark Canada's performance against the rest of the world.
Canadian researcher publication productivity is very high and the country ranks 2nd in the G20 on the per capita output of publications in the NSE (see Figure 2.12). Canada ranks 11th in the overall number of publications produced in the past year (see Figure 2.13).
The high quality and impact of Canadian research is evident in its ranking among top countries on the average number of times Canadian R&D publications are cited by other researchers. Citations are a measure of the potential use of a researcher's work by other researchers.
Based on the number of citations received by scientific papers over the three years following the publication year, a standardized measure called the Average Relative Citation factor is calculated for each country and international comparisons made. Based on the most current data available (2013), Canada sits in 7th position (see Figure 2.14).
Other program highlights for the year include:
- NSERC continues to develop international partnerships with fellow research funding agencies in other countries to facilitate international research collaborations. In 2014-15, NSERC co-hosted the 3rd Annual Meeting of the Global Research Council along with the Chinese Academy of Sciences (CAS) and the National Natural Science Foundation of China (NSFC) in Beijing, China. The global meeting brought together the heads of approximately 70 science and research councils from around the world to facilitate collaborate and share best practices on topics such as promoting research integrity, supporting future generations of researchers, and creating open access to research publications.
- Following a recommendation from the International Review of NSERC's Discovery Program that the intent and nature of the Discovery Accelerator Supplements (DAS) be refined, the program description was modified. The new description aims to help target funding toward early-stage researchers who show evidence of early successes. The new program description was implemented during the 2015 Discovery Grants Competition.
- In March 2015, NSERC announced $150,000 in funding to three projects as part of a multinational research collaboration - the Belmont Forum - studying sustainability issues in the Arctic.
Figure 2.12
Natural Science and Engineering Article Production per Capita in the NSE, 2013, G20 Countries

Source: Observattoire des sciences et des technologies
Figure 2.13
Natural Science and Engineering Article Production in the NSE, 2013, G20 Countries

Source : Observatoire des sciences et des technologies
Figure 2.14
Average Relative Citation Factor (ARC) in the NSE, 2013, G20 Countries

Source : Observatoire des sciences et des technologies
Sub-program 1.2.1: Discovery Research
Description
This sub-program promotes and enables global excellence in discovery research in Canada. NSERC`s discovery-based grants support long-term, ongoing programs of research as well as shorter-term research projects. In addition, NSERC offers substantial and timely additional resources to select researchers in order to accelerate progress and maximize the impact of their research program. Having a solid capacity for basic research across a broad spectrum of natural sciences and engineering disciplines is necessary to ensure that Canada remains at the leading edge of knowledge creation. It ensures that Canada can access and exploit science and technology developments from other countries, and forms the foundation for training the next generation of scientists and engineers. This program uses funding from the following transfer payment: Grants and Scholarships.
| 2014-15 Planned Spending | 22014-15 Actual Spending | 2014-15 Difference (actual minus planned) |
|---|---|---|
| $379,408,043.00 | $377,335,385.00 | -$2,072,658.00 |
| 2014-15 Planned | 2014-15 Actual | 2014-15 Difference (actual minus planned) |
|---|---|---|
| 48 | 52 | 4 |
The variance is mainly due to resources provided by Budget 2014 for Advanced Research.
| Expected Results | Performance Indicators | Targets | Actual Results |
|---|---|---|---|
| The discovery, innovation and training capability of university researchers in natural sciences and engineering is enhanced by the provision of support for on-going programs of basic research. | Percentage of the Discovery Grants Program budget spent on early career researchers. | 10% | 11.1% |
| Percentage of funds spent on training students and postdoctoral fellows | 35% | 50.4% (see Figure 2.15) | |
| Percentage of Canadian publications in natural sciences and engineering coauthored with foreign researchers. | 40% | 53% (see Figure 2.16) |
Performance Analysis and Lessons Learned
The Discovery Grants Program provides funding to early career researchers to kick start their research at Canadian universities. In 2014-15, nearly 11.1% of Discovery Grants Program funding was awarded to early career researchers.
To be funded through Discovery Grants, researchers must demonstrate research excellence and high productivity, as well as contributions to the training of highly qualified people. For the most current year, 50.4% of the program's expenditures were spent on supporting the training of students at the undergraduate, masters, doctoral and postdoctoral levels, through stipends provided by NSERC-funded professors (see Figure 2.15).
Canada produces 4% of the world's science and engineering publications. As such, it is important for Canadian researchers to access the latest knowledge and expertise from around the world. One indicator of this activity is the number of Canadian publications co-authored with foreign researchers. As shown in Figure 2.16, over one-half of Canadian publications in the NSE in 2013 had a foreign collaborator, and this percentage has grown every year over the past decade.
Other program highlights for the year include:
- NSERC continues to support a strong and dynamic base of researchers by recognizing and supporting excellence with the Discovery Grants Program. The 2014 competition awarded Discovery Grants to 280 early-career researchers and 1,725 established researchers. The success rate (number of awards divided by the number of applications) for the 2014 competition was 64%. Due to the increased funding for advanced research through the federal budget, an additional $2.8M was added to the Discovery Grants budget.
- In October 2014, NSERC launched a 3rd call for proposals under its Discovery Frontiers initiative to fund research in emerging opportunities related to New Materials for Clean Energy and Energy Efficiency. Supporting advanced research in this area is a priority for Canada, and NSERC will provide total funding of $4 million over four years. This research is expected to span a wide range of disciplines, including materials physics, chemistry, microbiology and engineering. It should cover new approaches to making molecules and materials with low waste/energy properties, develop methods to examine the persistence and ecotoxicology of high-use molecules and seek replacements for problematic ones, thus leading to cleaner energy production. In March 2015, 30 Letters of Intent for the program were received and 6 were invited to apply. Results from the competition will be available in 2015-16.
Figure 2.15
Percentage of Discovery Grants Funds Used to Support Students and Fellows

Source : NSERC database.
Figure 2.16
Number of Internationally Co-authored Canadian Publications in the NSE and Share of Canadian Total

Source : Observatoire des sciences et des technologies
Sub-Program 1.2.2: Research Equipment and Resources
Description
This sub-program helps to support the acquisition, maintenance and operation of research equipment and major research resources. Funds are also used to facilitate researchers' access to major and unique research facilities in Canada and abroad. Grants are awarded through a competitive peer review process. This, in addition to funds to carry out research, helps support top scientists and engineers' access to state-of-the-art equipment and facilities to carry out research at world-class levels. Access to top facilities plays an important role in attracting the best minds to Canada and keeping them here. This program uses funding from the following transfer payment: Grants and Scholarships.
| 2014-15 Planned Spending | 22014-15 Actual Spending | 2014-15 Difference (actual minus planned) |
|---|---|---|
| $14,760,722.00 | $40,477,319.00 | $25,716,597.00 |
The variance is due to unused funds from other NSERC programs transferred to Research Tools and Instruments under Sub-Program 1.2.2
| 2014-15 Planned | 2014-15 Actual | 2014-15 Difference (actual minus planned) |
|---|---|---|
| 2 | 3 | 1 |
| Expected Results | Performance Indicators | Targets | Actual Results |
|---|---|---|---|
| The discovery, innovation, and training capability of university researchers in natural sciences and engineering is supported by access to research equipment and major regional or national research facilities. | Percentage growth in number of users conducting research at supported facilities. | 5% | 1.5% (see Figure 2.17) |
| Average number of researchers benefiting from equipment awards. | 100 | 1,006 (see Figure 2.18) |
Performance Analysis and Lessons Learned
A tracking of the annual number of users conducting research at NSERC supported facilities is presented in Figure 2.17. Over the past year there were 13 more users, a 1.5% growth compared to 2013-14.
Current user capacity is nearing its limit, but by 2016-17, an additional eight experimental facilities will come online and increase the user capacity to 1,500 per year.
In 2014-15, 1,006 researchers benefited from an NSERC Research Tools and Instruments grant (see Figure 2.18). Based upon consultations with the research community in 2012-13, in 2013-2014, NSERC introduced a quota system to this program in order to reduce the burden of peer review on the community. Universities were provided with a quota of the number of applications that they could submit to NSERC for the Research Tools and Instruments grants. In 2014-15 NSERC increased its investments in the budget of the Research Tools and Instruments Program to $25M and increased its quota to universities to 700, allowing more researchers to benefit from the program.
In July 2014, NSERC announced the results of its first Collaborative and Thematic Resources Support in Mathematics and Statistics (CTRMS) Program competition. The three recipients are the Centre de recherches mathématiques (CRM), the Fields Institute for Research in Mathematical Sciences and the Pacific Institute for the Mathematical Sciences (PIMS) receiving a total of $3.5 million annually for five years. Together, the three institutes will provide support from their CTRMS awards of $405,000 per year to the newly formed Canadian Statistical Sciences Institute and will also continue to provide support for the Atlantic Association for Research in the Mathematical Sciences through their CTRMS awards. In addition, NSERC has provided the three institutes above - CRM, Fields, and PIMS - with $1.5 million over three years to set up an Institute Innovation Platform that will foster partnerships between mathematics and statistics researchers and non-academic partners in the public and private sectors.
In May, 2014, NSERC launched a second call for proposals under the CTRMS Program. Results are expected in 2015-16.
Figure 2.17
Number of Users Conduction Research at Supported Facilities

Source : Canadian Light Source annual reports.
Figure 2.18
Number of Researchers Benefiting from a NSERC Research Tools and Instruments Grant
Source : NSERC database.
Program 1.3 - Innovation: Research Partnerships
Description
This program fosters partnerships in natural sciences and engineering that facilitates the transfer of knowledge and skills to the user sector through awards that support research projects and network activities intended for socioeconomic impact. The partnerships encouraged and enabled by these awards also increase the commercialization of Canada's research through new products, services and processes for the benefit of all Canadians.
| 2014-15 Main Estimates | 2014-15 Planned Spending | 2014-15 Total Authorities Available for Use | 2014-15 Actual Spending (authorities used) | 2014-15 Difference (actual minus planned) |
|---|---|---|---|---|
| $369,062,488.00 | $369,062,488.00 | $374,634,239.00 | $371,301,195.00 | $2,238,707.00 |
| 2014-15 Planned | 2014-15 Actual | 2014-15 Difference |
|---|---|---|
| 123 | 119 | -4 |
| Expected Results | Performance Indicators | Targets | Actual Results |
|---|---|---|---|
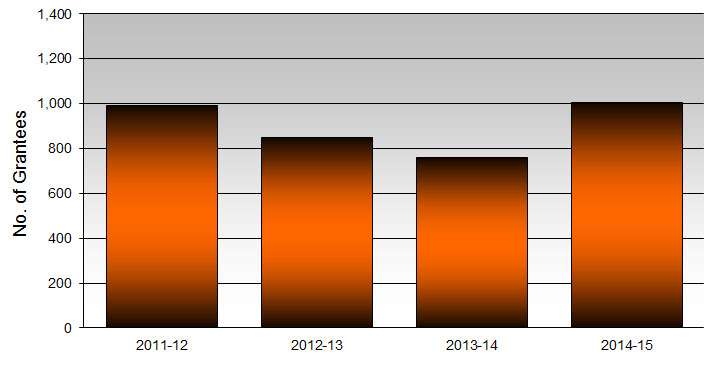
| Canada builds more research partnerships between businesses, universities and colleges. | Percentage growth in the number of business partners annually. | 5% | 13.2% (see Figure 2.18) |
| Minimum percentage growth in most of the indicators of knowledge/technology transfer (new and/or improved products/services, enhanced skills/knowledge of partner personnel, invention disclosures, university spin-offs, university licensing revenue, university R&D contract revenue, university patents). | 0.5% | Growth in 4 of 9 indicators (see Figure 2.20) |
Performance Analysis and Lessons Learned
In 2014-15, there was a 13% growth in the number of companies partnering with NSERC. Since the launch of the Strategy for Partnerships and Innovation in 2009-10, the number of industrial partners participating in NSERC programs has grown steadily every year, reaching 3,513 in 2014-15 (Figure 2.19). The majority of the top 100 R&D firms in Canada are currently partners with NSERC. Industrial partners contribute financially to post-secondary research projects, scholarships and fellowships.
The Association of University Technology Managers conducts a survey of intellectual property commercialization in the North American university sector every year. Figure 2.20 shows that growth exceeded the 0.5% threshold for 4 of the 9 indicators over the past year.
Canadian universities are very good at attracting funding from companies to conduct collaborative research of importance to the firm. While overall business R&D spending by Canadian firms has stagnated recently, since 2007 Canadian firms continue to increase their funding for university R&D (see Figure 2.21). This example of Canadian university-industry collaboration is one of the best in the G20.
Figure 2.19
Number of Industrial Partners Participating in NSERC Programs

Source : NSERC database.
Figure 2.20
Canadian University1 Intellectual Property Commercialization
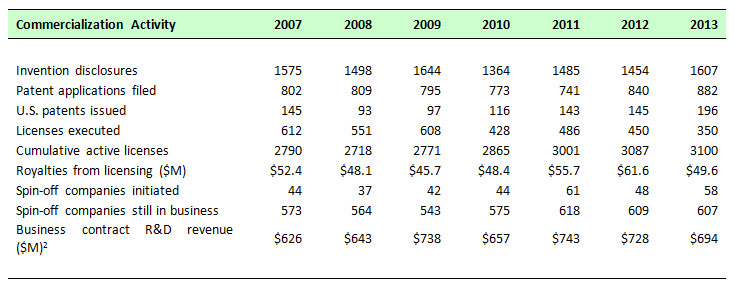
Source : Association of University Technology Managers (AUTM), Canadian Association of University Business Officers (CAUBO).
1. Sample of Canadian universities including: Alberta, British Columbia, Calgary, Dalhousie, Ecole de Technologie Superieure, Guelph, Laval, Manitoba, McGill, McMaster, Memorial, Montreal, Mount Allison, New Brunswick, Ottawa, Saskatchewan, Sherbrooke, Simon Fraser, St. Mary's, Toronto, Waterloo, Western, and Victoria.
2. Includes all Canadian universities.
Figure 2.21
Trends in Canadian Industrial R&D Expenditures and Industrial Funding of Canadian University R&D

Source : Statistics Canada.
Seneca Students up Mozilla's Game in Online Worlds
David Humphrey, Seneca College of Applied Arts and Technology
Students at Seneca College and high-tech company Mozilla have worked together for a decade to make its popular online browser Firefox more interactive, while giving students job-ready skills in Canada's world-leading video game sector. Mozilla is more globally competitive thanks to its close partnership with Professor David Humphrey and his students at Seneca College, renowned for their expertise in solving complex computer problems. The web developer's open source platform has made it possible for hundreds of Seneca students to contribute their own ideas and code to help make Firefox more interactive in the online media and gaming space. Among them: developing console-like features that make it possible for online gamers to navigate 3-D environments; inventing a way for web media to dynamically generate sound effects; producing animated graphics within Firefox; making it possible to include subtitles and captions in web videos; and developing a free open source web app, called Popcorn, which allows anyone to enhance, remix and share video or audio files on the web.
A dozen Seneca graduates now work for Mozilla and are mentoring the next generation of Seneca students. The success of the partnership has helped Mozilla grow its Canadian staff significantly: Since they began working together in 2005, Mozilla's Toronto office has grown from two employees to more than 80.This research partnership is expected to continue well into the future. New projects are focusing on Mozilla's Webmaker initiative, a set of web-based tools, curriculum, and an online social platform aimed at helping teachers and students connect, teach and learn the web.
Sub-Program 1.3.1: Research in Strategic Areas
Description
This sub-program supports research projects and activities in selected areas of national importance and in emerging areas that are of potential significance to Canada. This program is necessary to take advantage of Canada's established excellence in research and innovation, and to build capacity in areas that are critical to the Canadian economy. NSERC invests in research areas that have been carefully selected as strategic priorities for the country. These investments support a range of activities such as research projects and networks. Funded activities share the common goal of connecting researchers with end users in order to enable the transfer of knowledge/technology and expertise that increases Canadian prosperity. This program uses funding from the following transfer payment: Grants and Scholarships.
| 2014-15 Planned Spending | 22014-15 Actual Spending | 2014-15 Difference (actual minus planned) |
|---|---|---|
| $98,841,253.00 | $94,200,046.00 | -$4,641,207.00 |
The variance is due to a realignment of resources to high demand, industry driven collaborative research (Sub-Program 1.3.2)
| 2014-15 Planned | 2014-15 Actual | 2014-15 Difference (actual minus planned) |
|---|---|---|
| 33 | 30 | -3 |
| Expected Results | Performance Indicators | Targets | Actual Results |
|---|---|---|---|
| Research and training in targeted and emerging areas of national importance is accelerated. | Percentage of projects demonstrating knowledge transfer in strategic areas. | 50% | 51% |
| Number of students and fellows carrying out research in strategic areas. | 1,500 | 2,295 |
Performance Analysis and Lessons Learned
From the 2012 evaluation of the Strategic Projects Program, 51% of industrial partners indicated that they had used the research results generated from Strategic Project grant. Large firms (63%) used the results more frequently as compared to small firms (46%). Forty-seven percent of NSERC funding in strategic areas was used to support university students and fellows in 2014-15, or more than 2,200 individuals.
Sub-Program 1.3.2: Industry-driven Collaborative Research and Development
Description
This sub-program fosters collaborations between university researchers and industry, as well as other sectors, to develop and apply new knowledge with Canadian-based organizations. It offers a range of industry-driven programs that stimulate innovation in the Canadian economy and encourage greater science and technology investment by the private sector. These partnership programs and projects address real-world challenges that are relevant to industry, help build sustainable relationships between the two sectors, and connect people and skills. This program uses funding from the following transfer payment: Grants and Scholarships.
| 2014-15 Planned Spending | 2014-15 Actual Spending | 2014-15 Difference (actual minus planned) |
|---|---|---|
| $141,109,980.00 | $145,181,544.00 | $4,071,564.00 |
The variance is due to a realignment of resources to high demand, industry driven collaborative research (Sub-Program 1.3.2)
| 2014-15 Planned | 2014-15 Actual | 2014-15 Difference (actual minus planned) |
|---|---|---|
| 47 | 47 | 0 |
| Expected Results | Performance Indicators | Targets | Actual Results |
|---|---|---|---|
| Mutually beneficial collaborations between the private sector and researchers in universities, resulting in industrial or economic benefits to Canada. | Percentage growth in total amount of research funds (cash and in-kind) leveraged from industrial partners. | 2% | 2.7% (see Figure 2.22) |
| Number of students and fellows solving industrial problems through collaboration. | 2,500 | 4,292 | |
| Percentage of industrial partners indicating satisfaction with research results. | 75% | 89% |
Performance Analysis and Lessons Learned
Industry funding in NSERC's industry-driven programs continues to climb and has more than doubled over the past decade. The latest year-over-year increase in industry funding came in at 2.7% (see Figure 2.20). In 2014-15, 54% of NSERC funding in industry-driven program areas was used to support university students and fellows, or more than 4,200 individuals.
The Industry-Driven program has continued to be in high demand with growth in its two primary funding opportunities: the Engage Grant and the Collaborative Research and Development Grant. NSERC consolidated similar programs offered to university and college researchers into a single Engage Grant. In 2014-15, 1,640 Engage Grants were awarded to either a university or college researcher to lead a project aimed at solving a company-specific problem. These projects involved 1,354 unique companies. Results reported by partnering companies at the conclusion of their projects indicate that: over 95% gained new knowledge/technology and describe the project as a success, 97% would recommend participating in an Engage Grant to other companies, and 70% intend to continue the collaboration.
Figure 2.22
Industrial Contributions to NSERC's Industry-Driven Programs

Source : NSERC database.
Sub-Program 1.3.3: Networks of Centres of Excellence
Description
This sub-program fosters partnerships among universities, industry, government and not-for-profit organizations. This program helps to harness the creativity and inventiveness of the best minds in various disciplines and sectors to find solutions to critical issues of importance to Canada using internationally competitive research, building on multi-sectoral partnerships and accelerating the use of multidisciplinary research results by organizations that can use them for economic, social, and environmental benefit to Canada. The program is jointly administered by the three federal granting agencies through the Network Centres of Excellence Secretariat. The networks supported through this program operate as virtual institutes to carry out research and knowledge/technology transfer activities among the participating organizations. The networks put in place well-defined strategies to transfer knowledge to users, ensuring that discoveries and technological advances are turned into social and economic benefits for all Canadians. The networks supported by this activity are designed to develop Canada's economy and improve the quality of life of Canadians. This program uses funding from the following transfer payments: Networks of Centres of Excellence and Business Led Networks of Centres of Excellence.
| 2014-15 Planned Spending | 22014-15 Actual Spending | 2014-15 Difference (actual minus planned) |
|---|---|---|
| $41,879,201.00 | $41,720,577.00 | -$158,624.00 |
The variance is due to a realignment of resources to high demand, industry driven collaborative research (Sub-Program 1.3.2)
| 2014-15 Planned | 2014-15 Actual | 2014-15 Difference (actual minus planned) |
|---|---|---|
| 14 | 14 | 0 |
| Expected Results | Performance Indicators | Targets | Actual Results |
|---|---|---|---|
| Strong linkages and partnerships between university, government and industry, and other users (NGOs) and the research knowledge and technology produced by the networks and centres is transferred and used with economic and societal benefits to Canada. | Percentage of established networks and centres demonstrating knowledge and technology transfer (e.g. number of patents, licenses, copyrights, number of new products or processes, policies created, new capacities established and/or processes or practices affected) | 100% | 100% |
Performance Analysis and Lessons Learned
A joint evaluation of the Networks of Centres of Excellence Program and the Business-Led Networks of Centres of Excellence was initiated in 2013-14 and results are expected in fall 2015. A program audit of the NCE Program was also undertaken in 2013-14. The audit has identified several positive findings in areas linked to the core activities of the program, most noteworthy were findings related to the adjudication of applications and award payment. The program's peer review assessments have been found to be consistent, well documented and decisions were supported by thorough justifications, highlighting the quality of the peer reviewer's work, as well as the diligence and professionalism of the current complement of staff.
Sub-Program 1.3.4: Training in Industry
Description
This sub-program supports students and recent graduates during short or longer term research internships in Canadian companies. The support allows them to gain R&D experience in industry and encourages them to consider careers in industry. Canadian companies benefit from the advanced research skills of these trainees and gain access to new knowledge in their area of activity. The awards are leveraged by the host company, which contributes to the salary of the student or fellow. The program supports an increase in the number of highly qualified people in Canadian industry to strengthen Canadian innovation. This program uses funding from the following transfer payments: Industrial Research and Development Internship Program and Grants and Scholarships.
| 2014-15 Planned Spending | 2014-15 Actual Spending | 2014-15 Difference (actual minus planned) |
|---|---|---|
| $27,933,431.00 | $25,890,272.00 | -$2,043,159.00 |
| 2014-15 Planned | 2014-15 Actual | 2014-15 Difference (actual minus planned) |
|---|---|---|
| 9 | 9 | 0 |
| Expected Results | Performance Indicators | Targets | Actual Results |
|---|---|---|---|
| Students and fellows gain research experience in an industrial setting. | Percentage of Industrial R&D Fellows continuing to work in industry after their fellowship. | 50% | 68.9 |
| Percentage of undergraduate students considering an industrial R&D career (after their Undergraduate Student Research Award). | 50% | 51% |
Performance Analysis and Lessons Learned
A 2013 survey of Industrial R&D fellows seven years after their award indicates that 68.9% of fellows continue to work in industry. The retention of these fellows in industry is important to help support Canada's business R&D effort. The Undergraduate Student Research Award in Industry program is another important way NSERC attempts to stimulate industrial R&D interest. The most recent exit survey of USRA-I recipients of this award shows that 51.1% of the students are considering a career in industry after their education is completed. The 2013 evaluation of the Industrial R&D Internship program revealed that 83% of industrial partner supervisors indicated that the internship was effective in addressing the needs of the firm.
Sub-Program 1.3.5: Commercialization of Research
Description
This sub-program supports the development of commercially promising technologies and promotes the transfer of knowledge and technologies to Canadian companies for commercialization. Strengthening Canada's record in commercialization is necessary to achieve business growth, job creation, and a stronger, more resilient economy. By means of grants awarded through competitive peer review processes, NSERC aims to support the development of pre-competitive technologies and to help build the capacity of Canadian universities and colleges to work with industry and fuel economic growth. Federal investments serve to leverage significant amounts of private funding. This program uses funding from the following transfer payments: Grants and Scholarships and the Centres of Excellence for Commercialization and Research.
| 2014-15 Planned Spending | 2014-15 Actual Spending | 2014-15 Difference (actual minus planned) |
|---|---|---|
| $9,562,730.00 | $14,970,301.00 | $5,407,571.00 |
The variance between planned and actual spending relates to the program cycle, where funding amounts are determined post-competition and appropriated through the Supplementary Estimates.
| 2014-15 Planned | 2014-15 Actual | 2014-15 Difference (actual minus planned) |
|---|---|---|
| 3 | 3 | 0 |
| Expected Results | Performance Indicators | Targets | Actual Results |
|---|---|---|---|
| Pre-competitive development of promising technology and the promotion of its transfer to new or established Canadian companies is facilitated. | Percentage of established centres in which technologies were commercially developed or projects resulting in creation or support of spin-offs, licensing revenue and/or agreements, venture capital funding or patents, copyrights, trademarks, registered industrial designs). | 100% | 100% |
| Percentage of projects resulting in intellectual property protection (patents, copyrights, trademarks, registered industrial designs). | 25% | 55% |
Performance Analysis and Lessons Learned
NSERC's commercialization support initiatives enhance the capacity of Canadian universities and colleges to transfer knowledge and technology from academic research laboratories to Canadian companies, and to accelerate the pre-commercial development of promising innovations. In 2014-15, all of the Centres of Excellence for Commercialization and Research reported technology development resulting in commercial outcomes (e.g. spin-off firms, licensing revenue, venture capital funding). Furthermore, 55% of Idea to Innovation projects have resulted in commercial success, including the creation of new spin-off companies and licensing agreements. This fraction will rise over the coming years, as it typically takes 3-5 years for commercial success to be observed from an Idea to Innovation funded-project.
NSERC continues to promote the commercialization of research by improving technology transfer proposals through the Market Assessment option for the Idea to Innovation grant - which has now been available for three years. The number of Market Assessment proposals reviewed by the Committee has increased from 26 in 2010-11 to 28 in 2014-15 and has greatly improved the success rate of these commercialization projects in achieving a full Idea to Innovation grant.
Sub-Program 1.3.6: College and Community Innovation
Description
This sub-program increases the capacity of colleges and polytechnics to support innovation at the community and/or regional level. The program design and funding stimulate new partnerships and increased entrepreneurship and assist colleges and polytechnics to take risks and be nimble in developing new ways of working with local businesses and industries to spur innovation and economic growth. This program uses funding from the following transfer payments: College and Community Innovation Program, College University Idea to Innovation, and the Industrial Research Chairs for colleges.
| 2014-15 Planned Spending | 2014-15 Actual Spending | 2014-15 Difference (actual minus planned) |
|---|---|---|
| $49,735,893.00 | $49,338,455.00 | -$397,438.00 |
| 2014-15 Planned | 2014-15 Actual | 2014-15 Difference (actual minus planned) |
|---|---|---|
| 17 | 16 | -1 |
| Expected Results | Performance Indicators | Targets | Actual Results |
|---|---|---|---|
| Increased capacity of colleges to support innovation at the community and/or regional level. | Percentage growth in number of partnerships with companies and other organizations. | 5% | 39.9% (see Figure 2.23) |
| Percentage of companies indicating development of new and/or improved products, services, and/or processes. | 25% | 69% |
Performance Analysis and Lessons Learned
The number of partners participating in College and Community Innovation Program grants has grown dramatically over the past five years (see Figure 2.21) and the latest year-over-year increase was 39.9%. More than two-thirds (69%) of companies had also experienced impacts on at least one aspect of their R&D capacity (i.e., their ability to introduce new or substantially improved products, processes or services to market; their ability to attract investments or their ability to make research investments). Federal Budget increases to the College and Community Innovation Program have occurred in 2008, 2010, 2011, 2013 and 2015.
Figure 2.23
Number of Industry, Non-profit, and Government Partners on NSERC's College Programs

Source : NSERC database. Excludes colleges and universities.
Internal Services
Description
Internal Services are groups of related activities and resources that are administered to support the needs of programs and other corporate obligations of an organization. For NSERC these groups are: Management and Oversight Services; Communications Services; Legal Services; Human Resources Management Services; Financial Management Services; Information Management Services; Information Technology Services; Real Property Services; Materiel Services; Acquisition Services; and Other Administrative Services. Internal Services include only those activities and resources that apply across an organization and not to those provided specifically to a program.
| 2014-15 Main Estimates | 2014-15 Planned Spending | 2014-15 Total Authorities Available for Use | 2014-15 Actual Spending (authorities used) | 2014-15 Difference (actual minus planned) |
|---|---|---|---|---|
| $23,869,561.00 | $23,869,561.00 | $26,212,740.00 | $24,168,828.00 | $299,267.00 |
| 2014-15 Planned | 2014-15 Actual | 2014-15 Difference (actual minus planned) |
|---|---|---|
| 172 | 174 | 2 |
Performance Analysis and Lessons Learned
In 2014-15, NSERC improved measures to strengthen financial accountabilities and improve its business processes and systems. NSERC has upgraded the departmental financial management system which will permit the agency to leverage new interoperability between systems and allow for enhanced reporting of financial information. The agency has also implemented a monitoring strategy for internal controls over financial reporting and a modernized financial monitoring framework which includes a long-term monitoring plan of the institutions that receive grant funding.
In September 2013, the Research Portal launched the Tri-Agency Harmonized form for the Canada Graduate Scholarship - Masters providing students with a common location and a single data set for application submission. The Research Portal also delivered functionality to allow Scholarship Liaison Officers to manage quotas, allocations and make offers to students directly through the Portal. Over 6,700 applications were submitted, approximately 2,800 of those applications targeted NSERC as their field of research.
Section III : Renseignements supplémentaires
Financial Statements Highlights
| Financial Information | 2014-15 Planned Results | 2014-15 Actual | 2013-14 Actual | Difference (2014-15 actual minus 2014-15 planned) | Difference (2014-15 actual minus 2013-14 actual) |
|---|---|---|---|---|---|
| Total expenses | 1,068,437,000 | 1,086,318,000 | 1,068,357,000 | 17,881,000 | 17,961,000 |
| Total revenues | - | 50,000 | 164,000 | 50,000 | (114,000) |
| Net cost of operations before government funding and transfers | 1,068,437,000 | 1,086,268,000 | 1,068,193,000 | 17,831,000 | 18,075,000 |
| Financial Information | 2014-15 | 2013-14 | Difference (2014-15 minus 2013-14) |
|---|---|---|---|
| Total net liabilities | 8,669,000 | 6,982,000 | 1,687,000 |
| Total net financial assets | 5,944,000 | 3,949,000 | 1,995,000 |
| Departmental net debt | 2,725,000 | 3,033,000 | (308,000) |
| Total non-financial assets | 8,192,000 | 6,445,000 | 1,747,000 |
| Departmental net financial position | 5,467,000 | 3,412,000 | 2,055,000 |
Financial Statements
Links to financial statements are found on NSERC's websitevi :
Supplementary Information Tables
The supplementary information tables listed in the 2014-15 Departmental Performance Report are available on NSERC's website.
- Departmental Sustainable Development Strategy
- Details on Transfer Payment Programs of $5 Million or More
- Internal Audits and Evaluations
Tax Expenditures and Evaluations
The tax system can be used to achieve public policy objectives through the application of special measures such as low tax rates, exemptions, deductions, deferrals and credits. The Department of Finance Canada publishes cost estimates and projections for these measures annually in the Tax Expenditures and Evaluations publication. The tax measures presented in the ![]() Tax Expenditures and Evaluationsvii publication are the responsibility of the Minister of Finance.
Tax Expenditures and Evaluationsvii publication are the responsibility of the Minister of Finance.
Section IV: Organizational Contact Information
For further information about this report, please contact:
Barney Laciak
Manager, Corporate Planning and Reporting
Natural Sciences and Engineering Research Council of Canada
Telephone: 613-996-1079
Email: barney.laciak@nserc-crsng.gc.ca
Appendix: Definitions
appropriation (crédit): Any authority of Parliament to pay money out of the Consolidated Revenue Fund.
budgetary expenditures (dépenses budgétaires): Includes operating and capital expenditures; transfer payments to other levels of government, organizations or individuals; and payments to Crown corporations.
Departmental Performance Report (rapport ministériel sur le rendement): Reports on an appropriated organization's actual accomplishments against the plans, priorities and expected results set out in the corresponding Report on Plans and Priorities. These reports are tabled in Parliament in the fall.
full-time equivalent (équivalent temps plein): Is a measure of the extent to which an employee represents a full person-year charge against a departmental budget. Full-time equivalents are calculated as a ratio of assigned hours of work to scheduled hours of work. Scheduled hours of work are set out in collective agreements.
Government of Canada outcomes (résultats du gouvernement du Canada): A set of 16 high level objectives defined for the government as a whole, grouped in four spending areas: economic affairs, social affairs, international affairs and government affairs.
Management, Resources and Results Structure (Structure de la gestion, des ressources et des résultats): A comprehensive framework that consists of an organization's inventory of programs, resources, results, performance indicators and governance information. Programs and results are depicted in their hierarchical relationship to each other and to the Strategic Outcome(s) to which they contribute. The Management, Resources and Results Structure is developed from the Program Alignment Architecture.
non-budgetary expenditures (dépenses non budgétaires): Includes net outlays and receipts related to loans, investments and advances, which change the composition of the financial assets of the Government of Canada.
performance (rendement): What an organization did with its resources to achieve its results, how well those results compare to what the organization intended to achieve and how well lessons learned have been identified.
performance indicator (indicateur de rendement): A qualitative or quantitative means of measuring an output or outcome, with the intention of gauging the performance of an organization, program, policy or initiative respecting expected results.
performance reporting (production de rapports sur le rendement): The process of communicating evidence-based performance information. Performance reporting supports decision making, accountability and transparency.
planned spending (dépenses prévues): For Reports on Plans and Priorities (RPPs) and Departmental Performance Reports (DPRs), planned spending refers to those amounts that receive Treasury Board approval by February 1. Therefore, planned spending may include amounts incremental to planned expenditures presented in the Main Estimates.
A department is expected to be aware of the authorities that it has sought and received. The determination of planned spending is a departmental responsibility, and departments must be able to defend the expenditure and accrual numbers presented in their RPPs and DPRs.
plans (plans): The articulation of strategic choices, which provides information on how an organization intends to achieve its priorities and associated results. Generally a plan will explain the logic behind the strategies chosen and tend to focus on actions that lead up to the expected result.
priorities (priorité): Plans or projects that an organization has chosen to focus and report on during the planning period. Priorities represent the things that are most important or what must be done first to support the achievement of the desired Strategic Outcome(s).
program (programme): A group of related resource inputs and activities that are managed to meet specific needs and to achieve intended results and that are treated as a budgetary unit.
Program Alignment Architecture (architecture d'alignement des programmes): A structured inventory of an organization's programs depicting the hierarchical relationship between programs and the Strategic Outcome(s) to which they contribute.
Report on Plans and Priorities (rapport sur les plans et les priorités): Provides information on the plans and expected performance of appropriated organizations over a three-year period. These reports are tabled in Parliament each spring.
results (résultats): An external consequence attributed, in part, to an organization, policy, program or initiative. Results are not within the control of a single organization, policy, program or initiative; instead they are within the area of the organization's influence.
statutory expenditures (dépenses législatives): Expenditures that Parliament has approved through legislation other than appropriation acts. The legislation sets out the purpose of the expenditures and the terms and conditions under which they may be made.
Strategic Outcome (résultat stratégique): A long-term and enduring benefit to Canadians that is linked to the organization's mandate, vision and core functions.
sunset program (programme temporisé): A time-limited program that does not have an ongoing funding and policy authority. When the program is set to expire, a decision must be made whether to continue the program. In the case of a renewal, the decision specifies the scope, funding level and duration.
target (cible): A measurable performance or success level that an organization, program or initiative plans to achieve within a specified time period. Targets can be either quantitative or qualitative.
voted expenditures (dépenses votées): Expenditures that Parliament approves annually through an Appropriation Act. The Vote wording becomes the governing conditions under which these expenditures may be made.
whole-of-government framework (cadre pangouvernemental): Maps the financial contributions of federal organizations receiving appropriations by aligning their Programs to a set of 16 government-wide, high-level outcome areas, grouped under four spending areas.
Endnotes
i: ![]() Natural Sciences and Engineering Research Act
Natural Sciences and Engineering Research Act
ii: ![]() Whole-of-government framework
Whole-of-government framework
iii: ![]() Public Accounts of Canada 2015
Public Accounts of Canada 2015
iv: ![]() Public Works and Government Services Canada website
Public Works and Government Services Canada website
v: ![]() Government of Canada Tax Expenditures
Government of Canada Tax Expenditures
Footnotes
1: Type is defined as follows: previously committed to—committed to in the first or second fiscal year prior to the subject year of the report; ongoing—committed to at least three fiscal years prior to the subject year of the report; and new—newly committed to in the reporting year of the RPP or DPR.